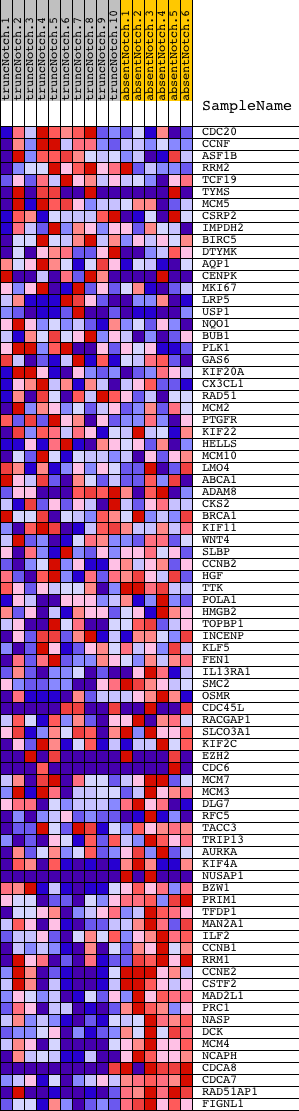
Profile of the Running ES Score & Positions of GeneSet Members on the Rank Ordered List
| Dataset | Set_03_absentNotch_versus_truncNotch.phenotype_absentNotch_versus_truncNotch.cls #truncNotch_versus_absentNotch |
| Phenotype | phenotype_absentNotch_versus_truncNotch.cls#truncNotch_versus_absentNotch |
| Upregulated in class | absentNotch |
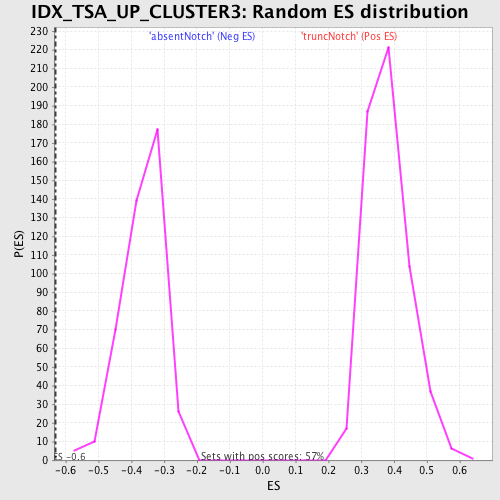
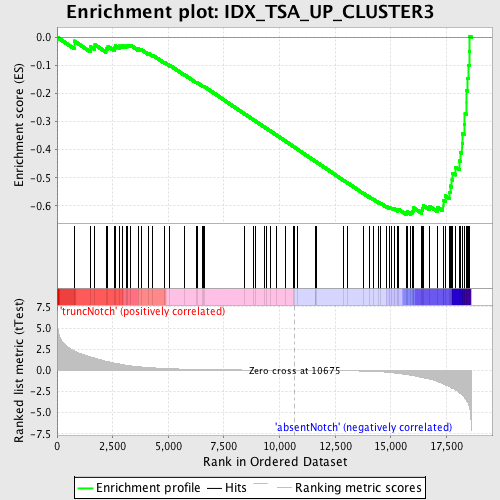
| GeneSet | IDX_TSA_UP_CLUSTER3 |
| Enrichment Score (ES) | -0.63060504 |
| Normalized Enrichment Score (NES) | -1.7300003 |
| Nominal p-value | 0.0 |
| FDR q-value | 0.04362188 |
| FWER p-Value | 0.406 |
| PROBE | DESCRIPTION (from dataset) | GENE SYMBOL | GENE_TITLE | RANK IN GENE LIST | RANK METRIC SCORE | RUNNING ES | CORE ENRICHMENT | |
|---|---|---|---|---|---|---|---|---|
| 1 | CDC20 | 3440017 3440044 6220088 | 770 | 2.302 | -0.0136 | No | ||
| 2 | CCNF | 6370288 | 1488 | 1.579 | -0.0331 | No | ||
| 3 | ASF1B | 6590706 | 1701 | 1.450 | -0.0269 | No | ||
| 4 | RRM2 | 6350059 6940162 | 2198 | 1.075 | -0.0406 | No | ||
| 5 | TCF19 | 6200152 | 2285 | 1.027 | -0.0327 | No | ||
| 6 | TYMS | 940450 1940068 3710008 5570546 | 2582 | 0.863 | -0.0382 | No | ||
| 7 | MCM5 | 2680647 | 2632 | 0.836 | -0.0307 | No | ||
| 8 | CSRP2 | 1030575 | 2810 | 0.742 | -0.0312 | No | ||
| 9 | IMPDH2 | 5220138 | 2938 | 0.677 | -0.0299 | No | ||
| 10 | BIRC5 | 110408 580014 1770632 | 3098 | 0.608 | -0.0311 | No | ||
| 11 | DTYMK | 2340377 | 3172 | 0.585 | -0.0279 | No | ||
| 12 | AQP1 | 450338 6020292 | 3304 | 0.537 | -0.0284 | No | ||
| 13 | CENPK | 1740722 6200068 | 3642 | 0.431 | -0.0414 | No | ||
| 14 | MKI67 | 3440750 4480072 7050288 | 3783 | 0.398 | -0.0441 | No | ||
| 15 | LRP5 | 2100397 3170484 | 4102 | 0.333 | -0.0572 | No | ||
| 16 | USP1 | 2760541 5690438 6220673 | 4294 | 0.302 | -0.0638 | No | ||
| 17 | NQO1 | 3450136 6840121 | 4847 | 0.226 | -0.0909 | No | ||
| 18 | BUB1 | 5390270 | 5073 | 0.197 | -0.1006 | No | ||
| 19 | PLK1 | 1780369 2640121 | 5726 | 0.143 | -0.1341 | No | ||
| 20 | GAS6 | 4480021 | 6253 | 0.110 | -0.1611 | No | ||
| 21 | KIF20A | 2650050 | 6291 | 0.108 | -0.1618 | No | ||
| 22 | CX3CL1 | 3990707 | 6538 | 0.096 | -0.1739 | No | ||
| 23 | RAD51 | 6110450 6980280 | 6595 | 0.093 | -0.1758 | No | ||
| 24 | MCM2 | 5050139 | 6622 | 0.092 | -0.1761 | No | ||
| 25 | PTGFR | 3850373 | 8406 | 0.041 | -0.2718 | No | ||
| 26 | KIF22 | 1190368 | 8827 | 0.032 | -0.2940 | No | ||
| 27 | HELLS | 4560086 4810025 | 8938 | 0.030 | -0.2996 | No | ||
| 28 | MCM10 | 4920632 | 9330 | 0.023 | -0.3204 | No | ||
| 29 | LMO4 | 3800746 | 9397 | 0.021 | -0.3237 | No | ||
| 30 | ABCA1 | 6290156 | 9591 | 0.018 | -0.3339 | No | ||
| 31 | ADAM8 | 450347 5670609 | 9872 | 0.013 | -0.3489 | No | ||
| 32 | CKS2 | 1410156 | 10263 | 0.007 | -0.3698 | No | ||
| 33 | BRCA1 | 4780669 | 10623 | 0.001 | -0.3892 | No | ||
| 34 | KIF11 | 5390139 | 10668 | 0.000 | -0.3916 | No | ||
| 35 | WNT4 | 4150619 | 10808 | -0.002 | -0.3990 | No | ||
| 36 | SLBP | 6220601 | 11603 | -0.016 | -0.4417 | No | ||
| 37 | CCNB2 | 6510528 | 11625 | -0.017 | -0.4426 | No | ||
| 38 | HGF | 3360593 | 11676 | -0.018 | -0.4451 | No | ||
| 39 | TTK | 3800129 | 12873 | -0.047 | -0.5090 | No | ||
| 40 | POLA1 | 4760541 | 13060 | -0.053 | -0.5184 | No | ||
| 41 | HMGB2 | 2640603 | 13760 | -0.085 | -0.5551 | No | ||
| 42 | TOPBP1 | 6020333 | 14021 | -0.105 | -0.5679 | No | ||
| 43 | INCENP | 520593 | 14226 | -0.124 | -0.5774 | No | ||
| 44 | KLF5 | 3840348 | 14460 | -0.153 | -0.5881 | No | ||
| 45 | FEN1 | 1770541 | 14554 | -0.166 | -0.5911 | No | ||
| 46 | IL13RA1 | 5550609 | 14804 | -0.214 | -0.6019 | No | ||
| 47 | SMC2 | 4810133 | 14946 | -0.247 | -0.6065 | No | ||
| 48 | OSMR | 1990519 | 15029 | -0.270 | -0.6077 | No | ||
| 49 | CDC45L | 70537 3130114 | 15150 | -0.305 | -0.6104 | No | ||
| 50 | RACGAP1 | 3990162 6620736 | 15317 | -0.354 | -0.6151 | No | ||
| 51 | SLCO3A1 | 1050408 2370156 6110072 | 15329 | -0.360 | -0.6113 | No | ||
| 52 | KIF2C | 6940082 | 15688 | -0.487 | -0.6247 | Yes | ||
| 53 | EZH2 | 6130605 6380524 | 15735 | -0.506 | -0.6210 | Yes | ||
| 54 | CDC6 | 4570296 5360600 | 15903 | -0.578 | -0.6230 | Yes | ||
| 55 | MCM7 | 3290292 5220056 | 15954 | -0.607 | -0.6183 | Yes | ||
| 56 | MCM3 | 5570068 | 16006 | -0.627 | -0.6135 | Yes | ||
| 57 | DLG7 | 3120041 | 16026 | -0.639 | -0.6067 | Yes | ||
| 58 | RFC5 | 3800452 6020091 | 16398 | -0.838 | -0.6166 | Yes | ||
| 59 | TACC3 | 5130592 | 16425 | -0.853 | -0.6076 | Yes | ||
| 60 | TRIP13 | 6860341 | 16446 | -0.868 | -0.5981 | Yes | ||
| 61 | AURKA | 780537 | 16736 | -1.026 | -0.6013 | Yes | ||
| 62 | KIF4A | 1410465 4760070 | 17097 | -1.317 | -0.6047 | Yes | ||
| 63 | NUSAP1 | 940048 3120435 | 17345 | -1.583 | -0.5988 | Yes | ||
| 64 | BZW1 | 460270 | 17347 | -1.584 | -0.5796 | Yes | ||
| 65 | PRIM1 | 6420746 | 17449 | -1.702 | -0.5643 | Yes | ||
| 66 | TFDP1 | 1980112 | 17630 | -1.906 | -0.5509 | Yes | ||
| 67 | MAN2A1 | 6650176 | 17674 | -1.980 | -0.5292 | Yes | ||
| 68 | ILF2 | 2900253 | 17748 | -2.089 | -0.5077 | Yes | ||
| 69 | CCNB1 | 4590433 4780372 | 17775 | -2.121 | -0.4834 | Yes | ||
| 70 | RRM1 | 4150433 | 17904 | -2.297 | -0.4624 | Yes | ||
| 71 | CCNE2 | 3120537 | 18087 | -2.639 | -0.4401 | Yes | ||
| 72 | CSTF2 | 6040463 | 18125 | -2.727 | -0.4090 | Yes | ||
| 73 | MAD2L1 | 4480725 | 18199 | -2.886 | -0.3779 | Yes | ||
| 74 | PRC1 | 870092 5890204 | 18210 | -2.929 | -0.3428 | Yes | ||
| 75 | NASP | 2260139 2940369 5130707 | 18304 | -3.185 | -0.3091 | Yes | ||
| 76 | DCK | 6900411 | 18333 | -3.283 | -0.2708 | Yes | ||
| 77 | MCM4 | 2760673 5420711 | 18391 | -3.505 | -0.2312 | Yes | ||
| 78 | NCAPH | 6220435 | 18392 | -3.506 | -0.1887 | Yes | ||
| 79 | CDCA8 | 2340286 6980019 | 18459 | -3.797 | -0.1461 | Yes | ||
| 80 | CDCA7 | 3060097 | 18498 | -4.044 | -0.0990 | Yes | ||
| 81 | RAD51AP1 | 4050736 6370528 | 18523 | -4.193 | -0.0494 | Yes | ||
| 82 | FIGNL1 | 6860390 | 18547 | -4.471 | 0.0037 | Yes |