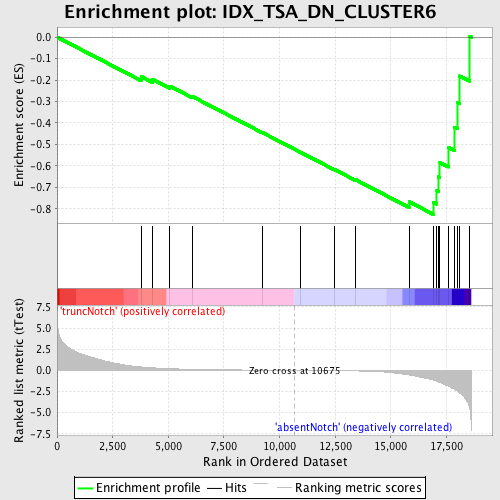
Profile of the Running ES Score & Positions of GeneSet Members on the Rank Ordered List
| Dataset | Set_03_absentNotch_versus_truncNotch.phenotype_absentNotch_versus_truncNotch.cls #truncNotch_versus_absentNotch |
| Phenotype | phenotype_absentNotch_versus_truncNotch.cls#truncNotch_versus_absentNotch |
| Upregulated in class | absentNotch |
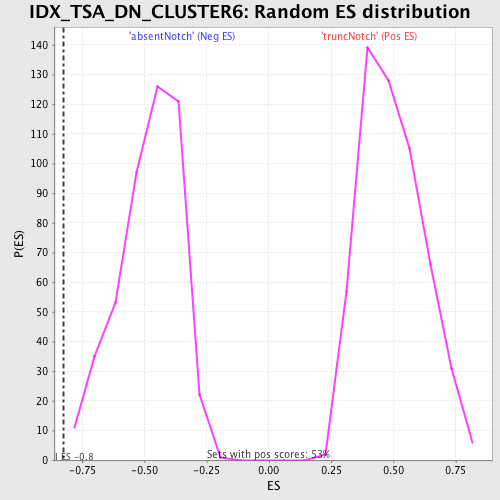
| GeneSet | IDX_TSA_DN_CLUSTER6 |
| Enrichment Score (ES) | -0.82685244 |
| Normalized Enrichment Score (NES) | -1.7267544 |
| Nominal p-value | 0.0 |
| FDR q-value | 0.04343813 |
| FWER p-Value | 0.423 |
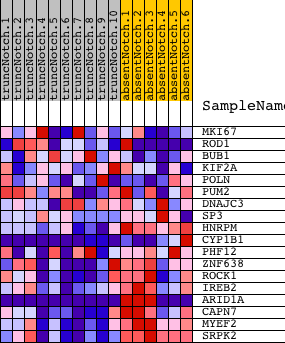
| PROBE | DESCRIPTION (from dataset) | GENE SYMBOL | GENE_TITLE | RANK IN GENE LIST | RANK METRIC SCORE | RUNNING ES | CORE ENRICHMENT | |
|---|---|---|---|---|---|---|---|---|
| 1 | MKI67 | 3440750 4480072 7050288 | 3783 | 0.398 | -0.1839 | No | ||
| 2 | ROD1 | 2060324 3140332 | 4292 | 0.302 | -0.1965 | No | ||
| 3 | BUB1 | 5390270 | 5073 | 0.197 | -0.2288 | No | ||
| 4 | KIF2A | 3990286 6130575 | 6089 | 0.119 | -0.2775 | No | ||
| 5 | POLN | 5290524 | 9231 | 0.024 | -0.4452 | No | ||
| 6 | PUM2 | 4200441 5910446 | 10923 | -0.004 | -0.5359 | No | ||
| 7 | DNAJC3 | 5720301 | 12478 | -0.036 | -0.6177 | No | ||
| 8 | SP3 | 3840338 | 13400 | -0.066 | -0.6640 | No | ||
| 9 | HNRPM | 450497 4540451 | 15821 | -0.542 | -0.7677 | No | ||
| 10 | CYP1B1 | 4760735 | 16923 | -1.156 | -0.7703 | Yes | ||
| 11 | PHF12 | 870400 3130687 | 17070 | -1.295 | -0.7148 | Yes | ||
| 12 | ZNF638 | 6510112 | 17142 | -1.369 | -0.6517 | Yes | ||
| 13 | ROCK1 | 130044 | 17206 | -1.431 | -0.5851 | Yes | ||
| 14 | IREB2 | 1570202 2640114 | 17587 | -1.859 | -0.5146 | Yes | ||
| 15 | ARID1A | 2630022 1690551 4810110 | 17864 | -2.236 | -0.4201 | Yes | ||
| 16 | CAPN7 | 5550050 | 18012 | -2.479 | -0.3067 | Yes | ||
| 17 | MYEF2 | 6860484 | 18089 | -2.650 | -0.1812 | Yes | ||
| 18 | SRPK2 | 6380341 | 18529 | -4.282 | 0.0047 | Yes |