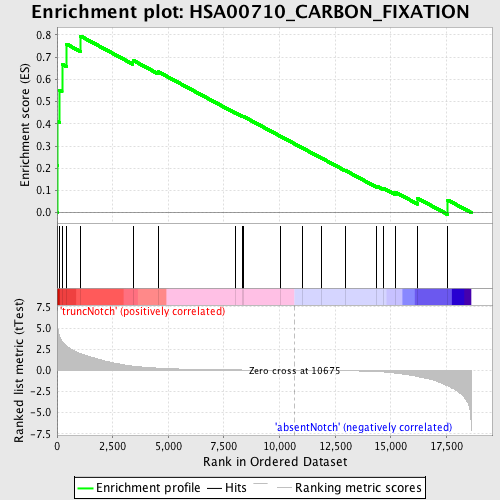
Profile of the Running ES Score & Positions of GeneSet Members on the Rank Ordered List
| Dataset | Set_03_absentNotch_versus_truncNotch.phenotype_absentNotch_versus_truncNotch.cls #truncNotch_versus_absentNotch |
| Phenotype | phenotype_absentNotch_versus_truncNotch.cls#truncNotch_versus_absentNotch |
| Upregulated in class | truncNotch |
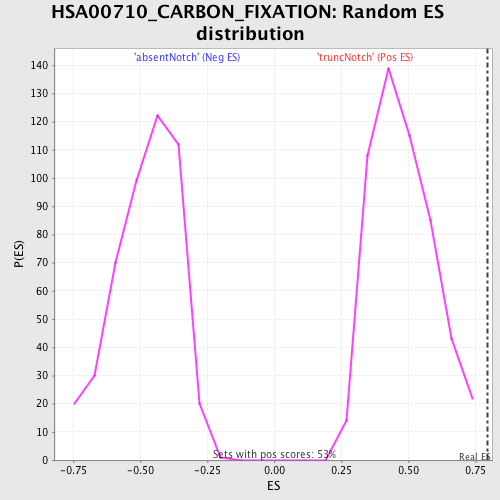
| GeneSet | HSA00710_CARBON_FIXATION |
| Enrichment Score (ES) | 0.79440635 |
| Normalized Enrichment Score (NES) | 1.6541207 |
| Nominal p-value | 0.0 |
| FDR q-value | 0.5019083 |
| FWER p-Value | 0.723 |
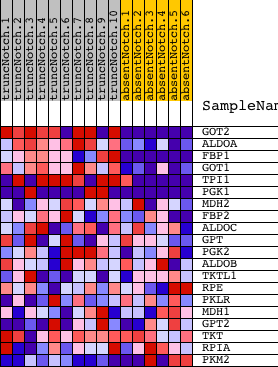
| PROBE | DESCRIPTION (from dataset) | GENE SYMBOL | GENE_TITLE | RANK IN GENE LIST | RANK METRIC SCORE | RUNNING ES | CORE ENRICHMENT | |
|---|---|---|---|---|---|---|---|---|
| 1 | GOT2 | 4570164 5220450 | 10 | 5.982 | 0.2124 | Yes | ||
| 2 | ALDOA | 6290672 | 20 | 5.593 | 0.4110 | Yes | ||
| 3 | FBP1 | 1470762 | 104 | 4.079 | 0.5517 | Yes | ||
| 4 | GOT1 | 2940465 | 220 | 3.438 | 0.6679 | Yes | ||
| 5 | TPI1 | 1500215 2100154 | 432 | 2.852 | 0.7581 | Yes | ||
| 6 | PGK1 | 1570494 630300 | 1055 | 1.960 | 0.7944 | Yes | ||
| 7 | MDH2 | 1850601 | 3411 | 0.501 | 0.6856 | No | ||
| 8 | FBP2 | 1580193 | 4546 | 0.261 | 0.6339 | No | ||
| 9 | ALDOC | 450121 610427 | 8021 | 0.050 | 0.4489 | No | ||
| 10 | GPT | 2350270 | 8318 | 0.043 | 0.4345 | No | ||
| 11 | PGK2 | 2650091 | 8391 | 0.041 | 0.4321 | No | ||
| 12 | ALDOB | 4730324 | 10059 | 0.010 | 0.3428 | No | ||
| 13 | TKTL1 | 2810672 6760102 | 11051 | -0.006 | 0.2897 | No | ||
| 14 | RPE | 940114 | 11897 | -0.022 | 0.2451 | No | ||
| 15 | PKLR | 1170400 2470114 | 12953 | -0.050 | 0.1901 | No | ||
| 16 | MDH1 | 6660358 6760731 | 14373 | -0.141 | 0.1189 | No | ||
| 17 | GPT2 | 1850463 | 14670 | -0.188 | 0.1096 | No | ||
| 18 | TKT | 6590064 6860039 | 15197 | -0.321 | 0.0928 | No | ||
| 19 | RPIA | 780079 | 16202 | -0.730 | 0.0648 | No | ||
| 20 | PKM2 | 6520403 70500 | 17558 | -1.826 | 0.0569 | No |