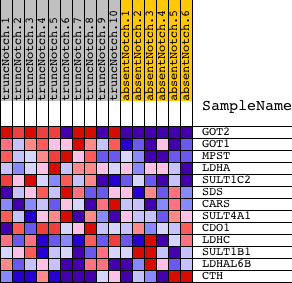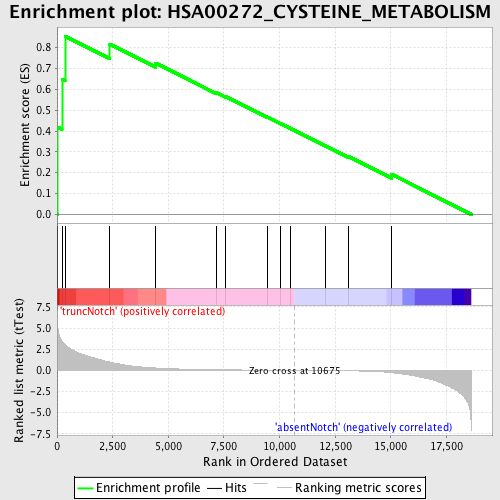
Profile of the Running ES Score & Positions of GeneSet Members on the Rank Ordered List
| Dataset | Set_03_absentNotch_versus_truncNotch.phenotype_absentNotch_versus_truncNotch.cls #truncNotch_versus_absentNotch |
| Phenotype | phenotype_absentNotch_versus_truncNotch.cls#truncNotch_versus_absentNotch |
| Upregulated in class | truncNotch |
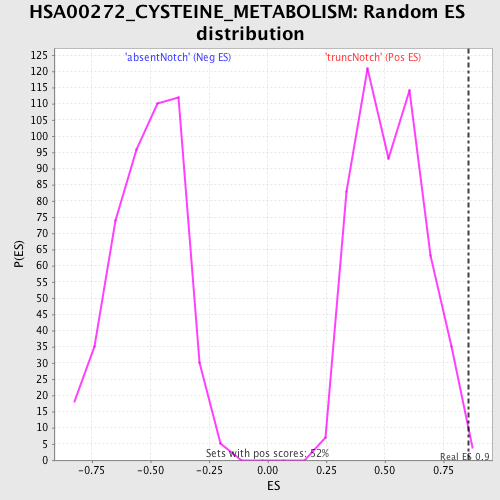
| GeneSet | HSA00272_CYSTEINE_METABOLISM |
| Enrichment Score (ES) | 0.8554329 |
| Normalized Enrichment Score (NES) | 1.6275544 |
| Nominal p-value | 0.005769231 |
| FDR q-value | 0.23444559 |
| FWER p-Value | 0.882 |
| PROBE | DESCRIPTION (from dataset) | GENE SYMBOL | GENE_TITLE | RANK IN GENE LIST | RANK METRIC SCORE | RUNNING ES | CORE ENRICHMENT | |
|---|---|---|---|---|---|---|---|---|
| 1 | GOT2 | 4570164 5220450 | 10 | 5.982 | 0.4190 | Yes | ||
| 2 | GOT1 | 2940465 | 220 | 3.438 | 0.6488 | Yes | ||
| 3 | MPST | 6380373 | 357 | 3.051 | 0.8554 | Yes | ||
| 4 | LDHA | 2190594 | 2371 | 0.987 | 0.8164 | No | ||
| 5 | SULT1C2 | 1740348 5910538 | 4415 | 0.282 | 0.7264 | No | ||
| 6 | SDS | 110242 6380725 | 7168 | 0.073 | 0.5835 | No | ||
| 7 | CARS | 460441 3140341 | 7563 | 0.060 | 0.5666 | No | ||
| 8 | SULT4A1 | 5270161 | 9469 | 0.020 | 0.4656 | No | ||
| 9 | CDO1 | 2480279 | 10034 | 0.011 | 0.4360 | No | ||
| 10 | LDHC | 2030458 6100463 | 10484 | 0.003 | 0.4121 | No | ||
| 11 | SULT1B1 | 2230750 5700102 | 12076 | -0.026 | 0.3284 | No | ||
| 12 | LDHAL6B | 5130280 | 13104 | -0.054 | 0.2770 | No | ||
| 13 | CTH | 1190332 5290139 | 15046 | -0.274 | 0.1919 | No |