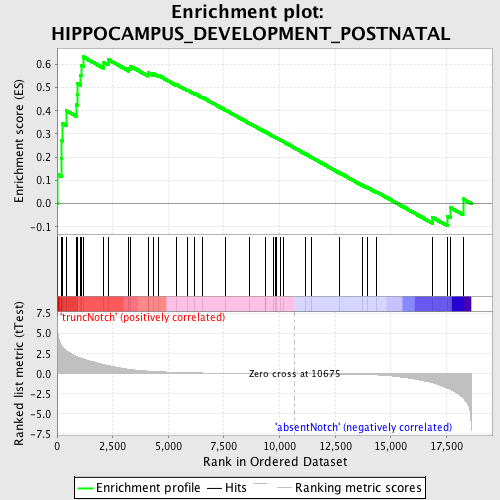
Profile of the Running ES Score & Positions of GeneSet Members on the Rank Ordered List
| Dataset | Set_03_absentNotch_versus_truncNotch.phenotype_absentNotch_versus_truncNotch.cls #truncNotch_versus_absentNotch |
| Phenotype | phenotype_absentNotch_versus_truncNotch.cls#truncNotch_versus_absentNotch |
| Upregulated in class | truncNotch |
| GeneSet | HIPPOCAMPUS_DEVELOPMENT_POSTNATAL |
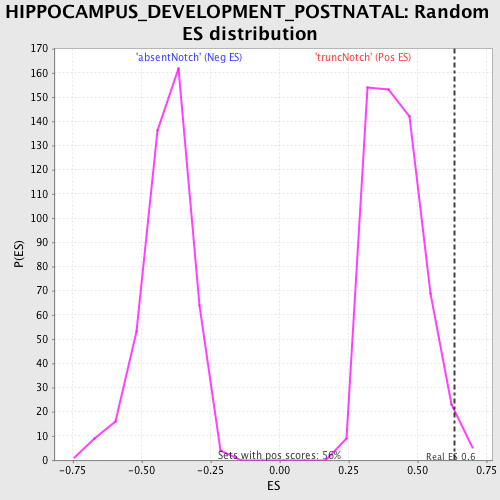
| Enrichment Score (ES) | 0.63249743 |
| Normalized Enrichment Score (NES) | 1.4980716 |
| Nominal p-value | 0.014414415 |
| FDR q-value | 0.6401693 |
| FWER p-Value | 1.0 |
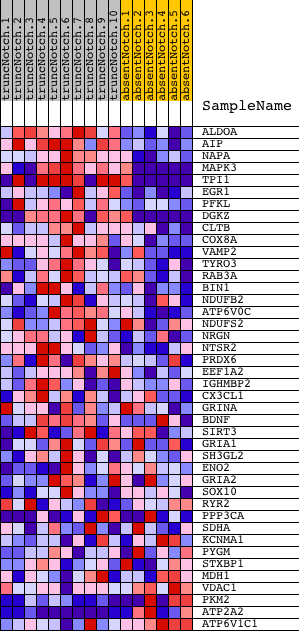
| PROBE | DESCRIPTION (from dataset) | GENE SYMBOL | GENE_TITLE | RANK IN GENE LIST | RANK METRIC SCORE | RUNNING ES | CORE ENRICHMENT | |
|---|---|---|---|---|---|---|---|---|
| 1 | ALDOA | 6290672 | 20 | 5.593 | 0.1247 | Yes | ||
| 2 | AIP | 5720300 | 207 | 3.492 | 0.1931 | Yes | ||
| 3 | NAPA | 1780537 5720102 | 213 | 3.466 | 0.2708 | Yes | ||
| 4 | MAPK3 | 580161 4780035 | 236 | 3.390 | 0.3458 | Yes | ||
| 5 | TPI1 | 1500215 2100154 | 432 | 2.852 | 0.3995 | Yes | ||
| 6 | EGR1 | 4610347 | 861 | 2.187 | 0.4256 | Yes | ||
| 7 | PFKL | 6200167 | 911 | 2.120 | 0.4706 | Yes | ||
| 8 | DGKZ | 3460041 6400129 | 927 | 2.098 | 0.5170 | Yes | ||
| 9 | CLTB | 5550037 | 1059 | 1.957 | 0.5539 | Yes | ||
| 10 | COX8A | 3780500 | 1101 | 1.912 | 0.5947 | Yes | ||
| 11 | VAMP2 | 2100100 | 1175 | 1.856 | 0.6325 | Yes | ||
| 12 | TYRO3 | 3130193 | 2073 | 1.158 | 0.6102 | No | ||
| 13 | RAB3A | 3940288 | 2293 | 1.023 | 0.6214 | No | ||
| 14 | BIN1 | 5420348 5670500 | 3226 | 0.565 | 0.5840 | No | ||
| 15 | NDUFB2 | 1230750 | 3303 | 0.538 | 0.5920 | No | ||
| 16 | ATP6V0C | 1780609 | 4086 | 0.337 | 0.5574 | No | ||
| 17 | NDUFS2 | 4850020 6200402 | 4091 | 0.335 | 0.5648 | No | ||
| 18 | NRGN | 4280433 | 4316 | 0.297 | 0.5594 | No | ||
| 19 | NTSR2 | 380047 | 4536 | 0.262 | 0.5535 | No | ||
| 20 | PRDX6 | 4920397 6380601 | 5346 | 0.171 | 0.5138 | No | ||
| 21 | EEF1A2 | 2260162 5290086 | 5865 | 0.134 | 0.4889 | No | ||
| 22 | IGHMBP2 | 2350292 | 6190 | 0.113 | 0.4740 | No | ||
| 23 | CX3CL1 | 3990707 | 6538 | 0.096 | 0.4575 | No | ||
| 24 | GRINA | 4570519 | 7586 | 0.060 | 0.4024 | No | ||
| 25 | BDNF | 2940128 3520368 | 8647 | 0.036 | 0.3462 | No | ||
| 26 | SIRT3 | 4010440 6040431 | 9344 | 0.022 | 0.3092 | No | ||
| 27 | GRIA1 | 1340152 3780750 4920440 | 9369 | 0.022 | 0.3084 | No | ||
| 28 | SH3GL2 | 1990176 3830494 | 9707 | 0.016 | 0.2906 | No | ||
| 29 | ENO2 | 2320068 | 9796 | 0.015 | 0.2862 | No | ||
| 30 | GRIA2 | 5080088 | 9861 | 0.014 | 0.2831 | No | ||
| 31 | SOX10 | 6200538 | 10046 | 0.010 | 0.2734 | No | ||
| 32 | RYR2 | 2760671 | 10167 | 0.008 | 0.2671 | No | ||
| 33 | PPP3CA | 4760332 6760092 | 11159 | -0.008 | 0.2140 | No | ||
| 34 | SDHA | 7000056 | 11428 | -0.013 | 0.1998 | No | ||
| 35 | KCNMA1 | 1450402 | 12701 | -0.042 | 0.1323 | No | ||
| 36 | PYGM | 3940300 | 13704 | -0.082 | 0.0802 | No | ||
| 37 | STXBP1 | 360072 6220717 | 13948 | -0.099 | 0.0693 | No | ||
| 38 | MDH1 | 6660358 6760731 | 14373 | -0.141 | 0.0497 | No | ||
| 39 | VDAC1 | 4760059 | 16869 | -1.117 | -0.0595 | No | ||
| 40 | PKM2 | 6520403 70500 | 17558 | -1.826 | -0.0555 | No | ||
| 41 | ATP2A2 | 1090075 3990279 | 17677 | -1.987 | -0.0172 | No | ||
| 42 | ATP6V1C1 | 2690324 5220528 | 18245 | -3.011 | 0.0200 | No |