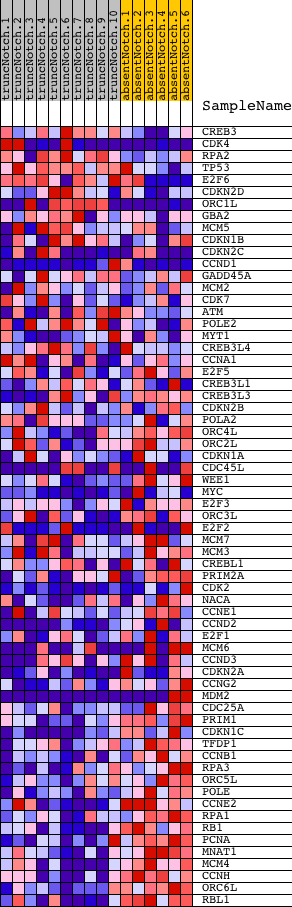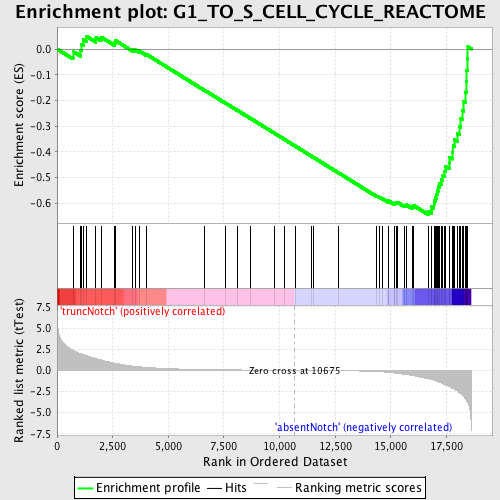
Profile of the Running ES Score & Positions of GeneSet Members on the Rank Ordered List
| Dataset | Set_03_absentNotch_versus_truncNotch.phenotype_absentNotch_versus_truncNotch.cls #truncNotch_versus_absentNotch |
| Phenotype | phenotype_absentNotch_versus_truncNotch.cls#truncNotch_versus_absentNotch |
| Upregulated in class | absentNotch |
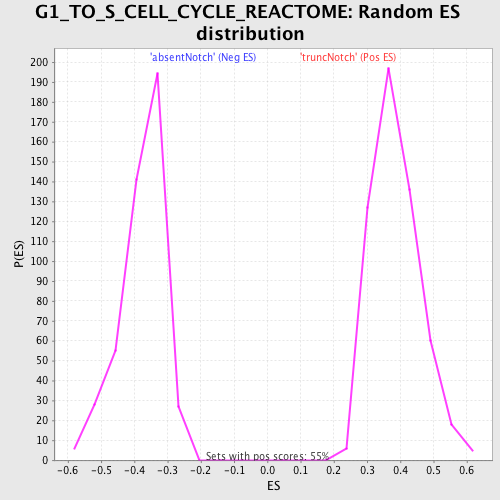
| GeneSet | G1_TO_S_CELL_CYCLE_REACTOME |
| Enrichment Score (ES) | -0.6433889 |
| Normalized Enrichment Score (NES) | -1.7157096 |
| Nominal p-value | 0.0 |
| FDR q-value | 0.04531605 |
| FWER p-Value | 0.494 |
| PROBE | DESCRIPTION (from dataset) | GENE SYMBOL | GENE_TITLE | RANK IN GENE LIST | RANK METRIC SCORE | RUNNING ES | CORE ENRICHMENT | |
|---|---|---|---|---|---|---|---|---|
| 1 | CREB3 | 5220408 | 716 | 2.391 | -0.0093 | No | ||
| 2 | CDK4 | 540075 4540600 | 1065 | 1.953 | -0.0041 | No | ||
| 3 | RPA2 | 2760301 5420195 | 1107 | 1.909 | 0.0172 | No | ||
| 4 | TP53 | 6130707 | 1179 | 1.852 | 0.0360 | No | ||
| 5 | E2F6 | 3120133 3850332 4070324 | 1311 | 1.729 | 0.0502 | No | ||
| 6 | CDKN2D | 6040035 | 1746 | 1.413 | 0.0441 | No | ||
| 7 | ORC1L | 2370328 6110390 | 1984 | 1.219 | 0.0463 | No | ||
| 8 | GBA2 | 2900372 | 2570 | 0.867 | 0.0254 | No | ||
| 9 | MCM5 | 2680647 | 2632 | 0.836 | 0.0324 | No | ||
| 10 | CDKN1B | 3800025 6450044 | 3383 | 0.512 | -0.0018 | No | ||
| 11 | CDKN2C | 5050750 5130148 | 3520 | 0.464 | -0.0034 | No | ||
| 12 | CCND1 | 460524 770309 3120576 6980398 | 3689 | 0.419 | -0.0073 | No | ||
| 13 | GADD45A | 2900717 | 4034 | 0.346 | -0.0216 | No | ||
| 14 | MCM2 | 5050139 | 6622 | 0.092 | -0.1599 | No | ||
| 15 | CDK7 | 2640451 | 7569 | 0.060 | -0.2102 | No | ||
| 16 | ATM | 3610110 4050524 | 8101 | 0.048 | -0.2382 | No | ||
| 17 | POLE2 | 6110041 | 8692 | 0.035 | -0.2696 | No | ||
| 18 | MYT1 | 6770524 | 9754 | 0.015 | -0.3266 | No | ||
| 19 | CREB3L4 | 1980736 | 10221 | 0.008 | -0.3516 | No | ||
| 20 | CCNA1 | 6290113 | 10698 | -0.000 | -0.3773 | No | ||
| 21 | E2F5 | 5860575 | 11453 | -0.014 | -0.4178 | No | ||
| 22 | CREB3L1 | 2350687 | 11537 | -0.015 | -0.4220 | No | ||
| 23 | CREB3L3 | 3450471 | 12645 | -0.040 | -0.4812 | No | ||
| 24 | CDKN2B | 6020040 | 14377 | -0.141 | -0.5728 | No | ||
| 25 | POLA2 | 940519 | 14472 | -0.155 | -0.5760 | No | ||
| 26 | ORC4L | 4230538 5550288 | 14630 | -0.180 | -0.5822 | No | ||
| 27 | ORC2L | 1990470 6510019 | 14885 | -0.231 | -0.5931 | No | ||
| 28 | CDKN1A | 4050088 6400706 | 14886 | -0.231 | -0.5902 | No | ||
| 29 | CDC45L | 70537 3130114 | 15150 | -0.305 | -0.6007 | No | ||
| 30 | WEE1 | 3390070 | 15186 | -0.317 | -0.5986 | No | ||
| 31 | MYC | 380541 4670170 | 15244 | -0.337 | -0.5976 | No | ||
| 32 | E2F3 | 50162 460180 | 15296 | -0.350 | -0.5960 | No | ||
| 33 | ORC3L | 3060348 | 15600 | -0.456 | -0.6068 | No | ||
| 34 | E2F2 | 5270609 5570377 7000465 | 15698 | -0.493 | -0.6060 | No | ||
| 35 | MCM7 | 3290292 5220056 | 15954 | -0.607 | -0.6123 | No | ||
| 36 | MCM3 | 5570068 | 16006 | -0.627 | -0.6073 | No | ||
| 37 | CREBL1 | 1340546 | 16676 | -0.994 | -0.6312 | Yes | ||
| 38 | PRIM2A | 7000692 | 16825 | -1.081 | -0.6259 | Yes | ||
| 39 | CDK2 | 130484 2260301 4010088 5050110 | 16838 | -1.088 | -0.6132 | Yes | ||
| 40 | NACA | 520326 5890673 | 16940 | -1.167 | -0.6043 | Yes | ||
| 41 | CCNE1 | 110064 | 16946 | -1.172 | -0.5902 | Yes | ||
| 42 | CCND2 | 5340167 | 17008 | -1.231 | -0.5784 | Yes | ||
| 43 | E2F1 | 5360093 | 17060 | -1.284 | -0.5654 | Yes | ||
| 44 | MCM6 | 60092 540181 6510110 | 17090 | -1.312 | -0.5509 | Yes | ||
| 45 | CCND3 | 380528 730500 | 17125 | -1.356 | -0.5361 | Yes | ||
| 46 | CDKN2A | 4670215 4760047 | 17178 | -1.404 | -0.5217 | Yes | ||
| 47 | CCNG2 | 3190095 | 17269 | -1.502 | -0.5081 | Yes | ||
| 48 | MDM2 | 3450053 5080138 | 17343 | -1.581 | -0.4926 | Yes | ||
| 49 | CDC25A | 3800184 | 17420 | -1.670 | -0.4762 | Yes | ||
| 50 | PRIM1 | 6420746 | 17449 | -1.702 | -0.4569 | Yes | ||
| 51 | CDKN1C | 6520577 | 17620 | -1.891 | -0.4428 | Yes | ||
| 52 | TFDP1 | 1980112 | 17630 | -1.906 | -0.4199 | Yes | ||
| 53 | CCNB1 | 4590433 4780372 | 17775 | -2.121 | -0.4017 | Yes | ||
| 54 | RPA3 | 5700136 | 17794 | -2.144 | -0.3764 | Yes | ||
| 55 | ORC5L | 1940133 1940711 | 17862 | -2.234 | -0.3526 | Yes | ||
| 56 | POLE | 6020538 | 18011 | -2.478 | -0.3301 | Yes | ||
| 57 | CCNE2 | 3120537 | 18087 | -2.639 | -0.3018 | Yes | ||
| 58 | RPA1 | 360452 | 18150 | -2.775 | -0.2711 | Yes | ||
| 59 | RB1 | 5900338 | 18205 | -2.912 | -0.2383 | Yes | ||
| 60 | PCNA | 940754 | 18279 | -3.090 | -0.2043 | Yes | ||
| 61 | MNAT1 | 730292 2350364 | 18373 | -3.445 | -0.1671 | Yes | ||
| 62 | MCM4 | 2760673 5420711 | 18391 | -3.505 | -0.1250 | Yes | ||
| 63 | CCNH | 3190347 | 18401 | -3.563 | -0.0818 | Yes | ||
| 64 | ORC6L | 2260592 | 18451 | -3.774 | -0.0381 | Yes | ||
| 65 | RBL1 | 3130372 | 18465 | -3.829 | 0.0081 | Yes |