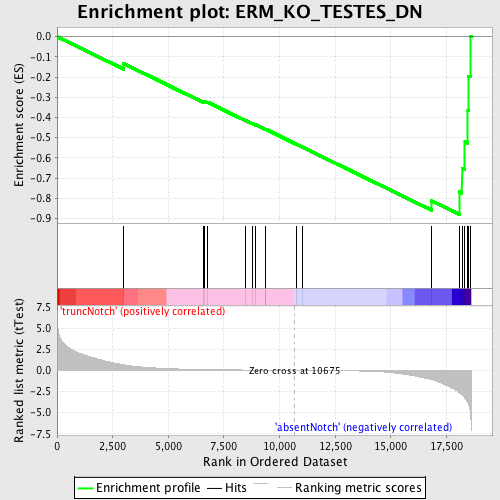
Profile of the Running ES Score & Positions of GeneSet Members on the Rank Ordered List
| Dataset | Set_03_absentNotch_versus_truncNotch.phenotype_absentNotch_versus_truncNotch.cls #truncNotch_versus_absentNotch |
| Phenotype | phenotype_absentNotch_versus_truncNotch.cls#truncNotch_versus_absentNotch |
| Upregulated in class | absentNotch |
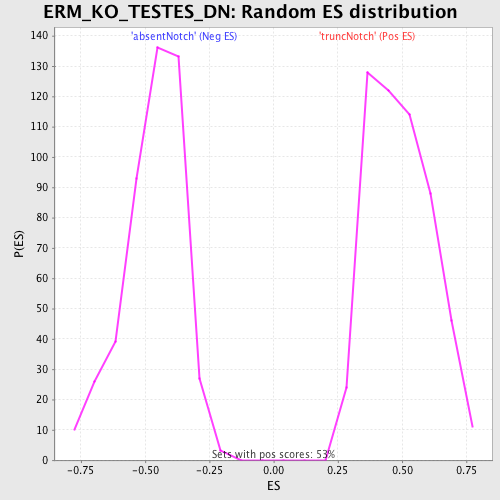
| GeneSet | ERM_KO_TESTES_DN |
| Enrichment Score (ES) | -0.88011664 |
| Normalized Enrichment Score (NES) | -1.883316 |
| Nominal p-value | 0.0 |
| FDR q-value | 0.0056010685 |
| FWER p-Value | 0.013 |
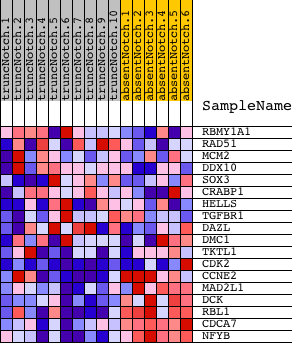
| PROBE | DESCRIPTION (from dataset) | GENE SYMBOL | GENE_TITLE | RANK IN GENE LIST | RANK METRIC SCORE | RUNNING ES | CORE ENRICHMENT | |
|---|---|---|---|---|---|---|---|---|
| 1 | RBMY1A1 | 6200053 | 2994 | 0.650 | -0.1334 | No | ||
| 2 | RAD51 | 6110450 6980280 | 6595 | 0.093 | -0.3230 | No | ||
| 3 | MCM2 | 5050139 | 6622 | 0.092 | -0.3205 | No | ||
| 4 | DDX10 | 520746 | 6767 | 0.086 | -0.3246 | No | ||
| 5 | SOX3 | 4570537 | 8457 | 0.040 | -0.4137 | No | ||
| 6 | CRABP1 | 450278 | 8777 | 0.033 | -0.4295 | No | ||
| 7 | HELLS | 4560086 4810025 | 8938 | 0.030 | -0.4368 | No | ||
| 8 | TGFBR1 | 1400148 4280020 6550711 | 9349 | 0.022 | -0.4579 | No | ||
| 9 | DAZL | 4050082 | 9386 | 0.022 | -0.4589 | No | ||
| 10 | DMC1 | 450341 | 10741 | -0.001 | -0.5317 | No | ||
| 11 | TKTL1 | 2810672 6760102 | 11051 | -0.006 | -0.5480 | No | ||
| 12 | CDK2 | 130484 2260301 4010088 5050110 | 16838 | -1.088 | -0.8130 | Yes | ||
| 13 | CCNE2 | 3120537 | 18087 | -2.639 | -0.7683 | Yes | ||
| 14 | MAD2L1 | 4480725 | 18199 | -2.886 | -0.6520 | Yes | ||
| 15 | DCK | 6900411 | 18333 | -3.283 | -0.5200 | Yes | ||
| 16 | RBL1 | 3130372 | 18465 | -3.829 | -0.3648 | Yes | ||
| 17 | CDCA7 | 3060097 | 18498 | -4.044 | -0.1952 | Yes | ||
| 18 | NFYB | 1850053 | 18567 | -4.754 | 0.0026 | Yes |