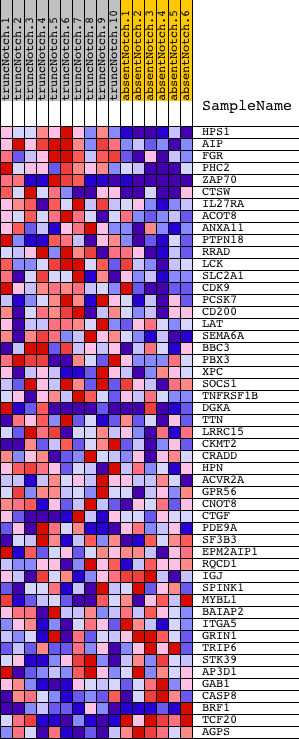
Profile of the Running ES Score & Positions of GeneSet Members on the Rank Ordered List
| Dataset | Set_03_absentNotch_versus_truncNotch.phenotype_absentNotch_versus_truncNotch.cls #truncNotch_versus_absentNotch |
| Phenotype | phenotype_absentNotch_versus_truncNotch.cls#truncNotch_versus_absentNotch |
| Upregulated in class | truncNotch |
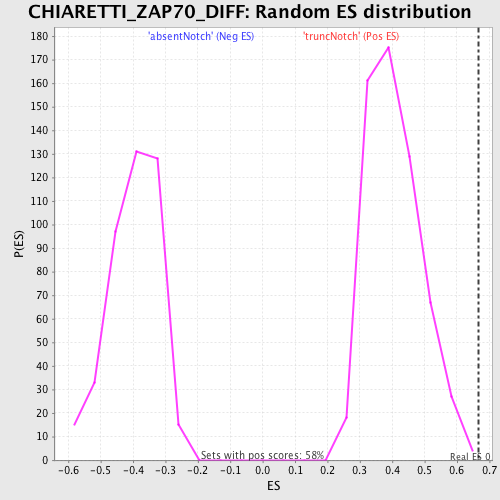
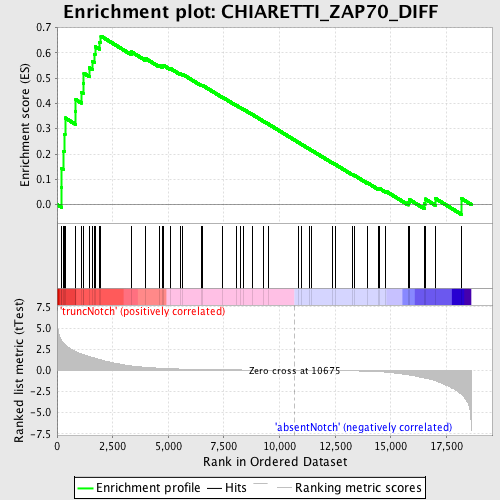
| GeneSet | CHIARETTI_ZAP70_DIFF |
| Enrichment Score (ES) | 0.6658373 |
| Normalized Enrichment Score (NES) | 1.6363856 |
| Nominal p-value | 0.0017211704 |
| FDR q-value | 0.35056347 |
| FWER p-Value | 0.841 |
| PROBE | DESCRIPTION (from dataset) | GENE SYMBOL | GENE_TITLE | RANK IN GENE LIST | RANK METRIC SCORE | RUNNING ES | CORE ENRICHMENT | |
|---|---|---|---|---|---|---|---|---|
| 1 | HPS1 | 2510026 | 196 | 3.532 | 0.0673 | Yes | ||
| 2 | AIP | 5720300 | 207 | 3.492 | 0.1438 | Yes | ||
| 3 | FGR | 3780047 | 295 | 3.215 | 0.2100 | Yes | ||
| 4 | PHC2 | 1430433 | 327 | 3.113 | 0.2769 | Yes | ||
| 5 | ZAP70 | 1410494 2260504 | 358 | 3.049 | 0.3425 | Yes | ||
| 6 | CTSW | 360368 | 823 | 2.238 | 0.3669 | Yes | ||
| 7 | IL27RA | 940093 | 840 | 2.211 | 0.4148 | Yes | ||
| 8 | ACOT8 | 2940039 5420025 | 1092 | 1.923 | 0.4437 | Yes | ||
| 9 | ANXA11 | 6370128 | 1172 | 1.860 | 0.4804 | Yes | ||
| 10 | PTPN18 | 2640537 | 1205 | 1.825 | 0.5189 | Yes | ||
| 11 | RRAD | 4280129 | 1461 | 1.596 | 0.5404 | Yes | ||
| 12 | LCK | 3360142 | 1591 | 1.510 | 0.5667 | Yes | ||
| 13 | SLC2A1 | 2100609 | 1676 | 1.465 | 0.5945 | Yes | ||
| 14 | CDK9 | 630707 | 1709 | 1.447 | 0.6247 | Yes | ||
| 15 | PCSK7 | 6370450 | 1904 | 1.273 | 0.6423 | Yes | ||
| 16 | CD200 | 940725 5260647 | 1970 | 1.228 | 0.6658 | Yes | ||
| 17 | LAT | 3170025 | 3335 | 0.527 | 0.6040 | No | ||
| 18 | SEMA6A | 2690138 3060021 | 3958 | 0.359 | 0.5784 | No | ||
| 19 | BBC3 | 2510494 4810278 | 4584 | 0.256 | 0.5504 | No | ||
| 20 | PBX3 | 1300424 3710577 6180575 | 4738 | 0.236 | 0.5473 | No | ||
| 21 | XPC | 6370193 | 4793 | 0.231 | 0.5495 | No | ||
| 22 | SOCS1 | 730139 | 5086 | 0.195 | 0.5381 | No | ||
| 23 | TNFRSF1B | 3990035 5860372 | 5536 | 0.157 | 0.5174 | No | ||
| 24 | DGKA | 5720152 5890328 | 5640 | 0.149 | 0.5151 | No | ||
| 25 | TTN | 2320161 4670056 6550026 | 6492 | 0.098 | 0.4714 | No | ||
| 26 | LRRC15 | 3940609 | 6540 | 0.096 | 0.4710 | No | ||
| 27 | CKMT2 | 1580288 | 7447 | 0.063 | 0.4236 | No | ||
| 28 | CRADD | 6770520 | 8067 | 0.049 | 0.3913 | No | ||
| 29 | HPN | 2470167 5220181 | 8236 | 0.045 | 0.3833 | No | ||
| 30 | ACVR2A | 6110647 | 8377 | 0.042 | 0.3767 | No | ||
| 31 | GPR56 | 1190494 | 8795 | 0.033 | 0.3549 | No | ||
| 32 | CNOT8 | 4590129 | 9286 | 0.023 | 0.3290 | No | ||
| 33 | CTGF | 4540577 | 9479 | 0.020 | 0.3191 | No | ||
| 34 | PDE9A | 5130167 | 10867 | -0.003 | 0.2445 | No | ||
| 35 | SF3B3 | 3710044 | 10980 | -0.005 | 0.2386 | No | ||
| 36 | EPM2AIP1 | 3360452 6590736 | 11345 | -0.011 | 0.2192 | No | ||
| 37 | RQCD1 | 1850139 | 11417 | -0.013 | 0.2157 | No | ||
| 38 | IGJ | 1170541 | 12363 | -0.033 | 0.1655 | No | ||
| 39 | SPINK1 | 1580008 | 12519 | -0.037 | 0.1580 | No | ||
| 40 | MYBL1 | 2900168 | 13257 | -0.060 | 0.1196 | No | ||
| 41 | BAIAP2 | 460347 4730600 | 13380 | -0.065 | 0.1145 | No | ||
| 42 | ITGA5 | 5550520 | 13934 | -0.098 | 0.0868 | No | ||
| 43 | GRIN1 | 3800014 7000609 | 14452 | -0.152 | 0.0624 | No | ||
| 44 | TRIP6 | 6520609 | 14485 | -0.157 | 0.0641 | No | ||
| 45 | STK39 | 50692 | 14763 | -0.207 | 0.0537 | No | ||
| 46 | AP3D1 | 4540138 | 15790 | -0.529 | 0.0101 | No | ||
| 47 | GAB1 | 2970156 | 15831 | -0.546 | 0.0200 | No | ||
| 48 | CASP8 | 4850154 | 16519 | -0.907 | 0.0030 | No | ||
| 49 | BRF1 | 2100047 | 16538 | -0.919 | 0.0223 | No | ||
| 50 | TCF20 | 1190338 1240520 4070594 4810440 | 16993 | -1.222 | 0.0248 | No | ||
| 51 | AGPS | 6980184 | 18179 | -2.837 | 0.0235 | No |