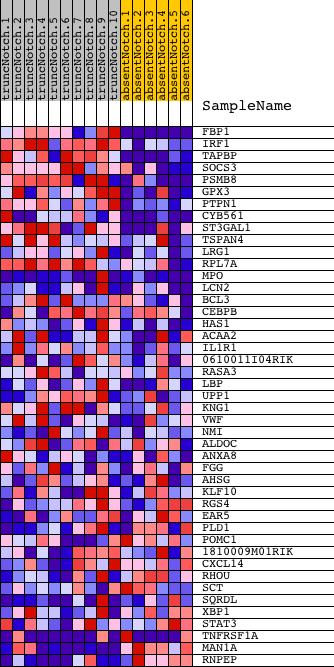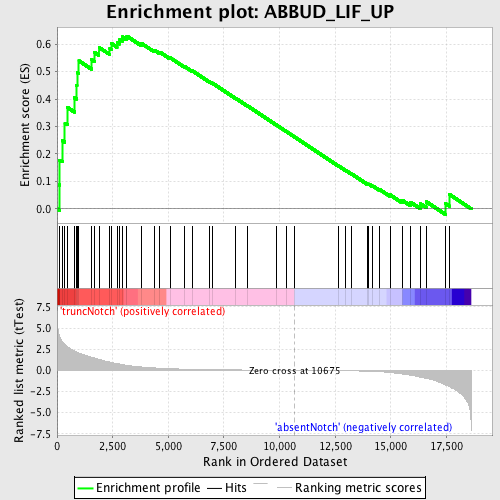
Profile of the Running ES Score & Positions of GeneSet Members on the Rank Ordered List
| Dataset | Set_03_absentNotch_versus_truncNotch.phenotype_absentNotch_versus_truncNotch.cls #truncNotch_versus_absentNotch |
| Phenotype | phenotype_absentNotch_versus_truncNotch.cls#truncNotch_versus_absentNotch |
| Upregulated in class | truncNotch |
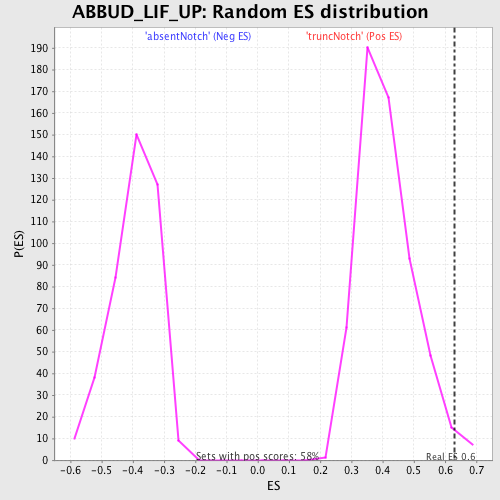
| GeneSet | ABBUD_LIF_UP |
| Enrichment Score (ES) | 0.62904835 |
| Normalized Enrichment Score (NES) | 1.5227851 |
| Nominal p-value | 0.020618556 |
| FDR q-value | 0.56734204 |
| FWER p-Value | 1.0 |
| PROBE | DESCRIPTION (from dataset) | GENE SYMBOL | GENE_TITLE | RANK IN GENE LIST | RANK METRIC SCORE | RUNNING ES | CORE ENRICHMENT | |
|---|---|---|---|---|---|---|---|---|
| 1 | FBP1 | 1470762 | 104 | 4.079 | 0.0873 | Yes | ||
| 2 | IRF1 | 2340152 3450592 6290121 6980577 | 118 | 3.979 | 0.1772 | Yes | ||
| 3 | TAPBP | 1980110 | 231 | 3.409 | 0.2488 | Yes | ||
| 4 | SOCS3 | 5550563 | 353 | 3.056 | 0.3119 | Yes | ||
| 5 | PSMB8 | 2850707 | 459 | 2.786 | 0.3697 | Yes | ||
| 6 | GPX3 | 1340450 | 782 | 2.292 | 0.4046 | Yes | ||
| 7 | PTPN1 | 2650056 | 874 | 2.174 | 0.4492 | Yes | ||
| 8 | CYB561 | 5080341 | 895 | 2.144 | 0.4969 | Yes | ||
| 9 | ST3GAL1 | 2640368 5420301 | 982 | 2.040 | 0.5388 | Yes | ||
| 10 | TSPAN4 | 5050647 | 1551 | 1.533 | 0.5431 | Yes | ||
| 11 | LRG1 | 5690605 | 1688 | 1.461 | 0.5691 | Yes | ||
| 12 | RPL7A | 5420458 | 1882 | 1.294 | 0.5881 | Yes | ||
| 13 | MPO | 2360176 2760440 5690176 | 2372 | 0.985 | 0.5842 | Yes | ||
| 14 | LCN2 | 2510112 | 2449 | 0.942 | 0.6016 | Yes | ||
| 15 | BCL3 | 3990440 | 2693 | 0.803 | 0.6068 | Yes | ||
| 16 | CEBPB | 2970019 | 2818 | 0.738 | 0.6169 | Yes | ||
| 17 | HAS1 | 2470048 | 2931 | 0.679 | 0.6264 | Yes | ||
| 18 | ACAA2 | 1570347 2360324 6130139 | 3135 | 0.597 | 0.6290 | Yes | ||
| 19 | IL1R1 | 3850377 6180128 | 3799 | 0.395 | 0.6023 | No | ||
| 20 | 0610011I04RIK | 5860064 | 4371 | 0.287 | 0.5781 | No | ||
| 21 | RASA3 | 2060465 | 4614 | 0.251 | 0.5708 | No | ||
| 22 | LBP | 6860019 | 5075 | 0.197 | 0.5505 | No | ||
| 23 | UPP1 | 3850358 3940100 | 5715 | 0.143 | 0.5194 | No | ||
| 24 | KNG1 | 6400576 6770347 | 6076 | 0.120 | 0.5028 | No | ||
| 25 | VWF | 4670519 | 6858 | 0.083 | 0.4626 | No | ||
| 26 | NMI | 520270 | 6971 | 0.079 | 0.4584 | No | ||
| 27 | ALDOC | 450121 610427 | 8021 | 0.050 | 0.4030 | No | ||
| 28 | ANXA8 | 4780022 | 8572 | 0.038 | 0.3743 | No | ||
| 29 | FGG | 4610717 | 9841 | 0.014 | 0.3063 | No | ||
| 30 | AHSG | 6450014 | 10297 | 0.006 | 0.2819 | No | ||
| 31 | KLF10 | 4850056 | 10681 | -0.000 | 0.2613 | No | ||
| 32 | RGS4 | 2970711 | 12660 | -0.041 | 0.1557 | No | ||
| 33 | EAR5 | 1580576 | 12960 | -0.050 | 0.1408 | No | ||
| 34 | PLD1 | 2450537 | 13247 | -0.060 | 0.1268 | No | ||
| 35 | POMC1 | 6450408 | 13964 | -0.100 | 0.0905 | No | ||
| 36 | 1810009M01RIK | 4210114 | 14005 | -0.104 | 0.0907 | No | ||
| 37 | CXCL14 | 840114 6450324 | 14190 | -0.121 | 0.0835 | No | ||
| 38 | RHOU | 2470706 | 14502 | -0.159 | 0.0704 | No | ||
| 39 | SCT | 2230348 | 14964 | -0.252 | 0.0513 | No | ||
| 40 | SQRDL | 6290132 | 15512 | -0.425 | 0.0315 | No | ||
| 41 | XBP1 | 3840594 | 15872 | -0.564 | 0.0250 | No | ||
| 42 | STAT3 | 460040 3710341 | 16330 | -0.801 | 0.0187 | No | ||
| 43 | TNFRSF1A | 1090390 6520735 | 16601 | -0.957 | 0.0259 | No | ||
| 44 | MAN1A | 3830091 | 17462 | -1.722 | 0.0188 | No | ||
| 45 | RNPEP | 2650685 | 17626 | -1.900 | 0.0533 | No |