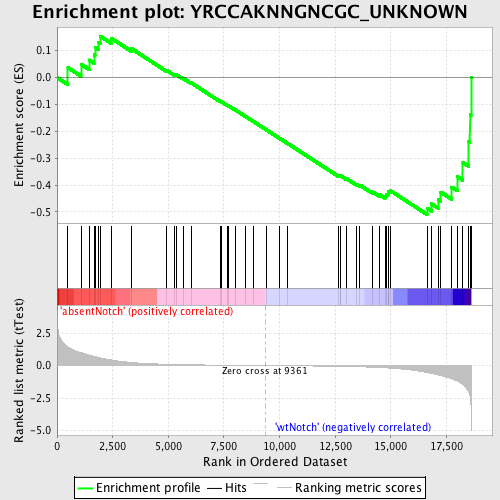
Profile of the Running ES Score & Positions of GeneSet Members on the Rank Ordered List
| Dataset | Set_03_absentNotch_versus_wtNotch.phenotype_absentNotch_versus_wtNotch.cls #absentNotch_versus_wtNotch.phenotype_absentNotch_versus_wtNotch.cls #absentNotch_versus_wtNotch_repos |
| Phenotype | phenotype_absentNotch_versus_wtNotch.cls#absentNotch_versus_wtNotch_repos |
| Upregulated in class | wtNotch |
| GeneSet | YRCCAKNNGNCGC_UNKNOWN |
| Enrichment Score (ES) | -0.5094066 |
| Normalized Enrichment Score (NES) | -1.334418 |
| Nominal p-value | 0.069869 |
| FDR q-value | 1.0 |
| FWER p-Value | 1.0 |
| PROBE | DESCRIPTION (from dataset) | GENE SYMBOL | GENE_TITLE | RANK IN GENE LIST | RANK METRIC SCORE | RUNNING ES | CORE ENRICHMENT | |
|---|---|---|---|---|---|---|---|---|
| 1 | FLNA | 5390193 | 488 | 1.422 | 0.0368 | No | ||
| 2 | GNAS | 630441 1850373 4050152 | 1074 | 0.997 | 0.0495 | No | ||
| 3 | GADD45B | 2350408 | 1443 | 0.803 | 0.0653 | No | ||
| 4 | HHEX | 2340575 | 1662 | 0.699 | 0.0846 | No | ||
| 5 | LHX2 | 3610463 | 1705 | 0.684 | 0.1127 | No | ||
| 6 | FRS3 | 5890048 | 1854 | 0.621 | 0.1323 | No | ||
| 7 | SFRS6 | 60224 | 1934 | 0.590 | 0.1542 | No | ||
| 8 | CRBN | 2470070 3120427 3610044 6900452 | 2432 | 0.427 | 0.1463 | No | ||
| 9 | CLDN1 | 5670746 | 3346 | 0.233 | 0.1075 | No | ||
| 10 | GAD1 | 2360035 3140167 | 4938 | 0.096 | 0.0261 | No | ||
| 11 | HOXA6 | 2340333 | 5273 | 0.082 | 0.0118 | No | ||
| 12 | CDK5R2 | 3800110 | 5365 | 0.079 | 0.0104 | No | ||
| 13 | HCRTR1 | 1580273 | 5664 | 0.069 | -0.0027 | No | ||
| 14 | MAG | 2370037 | 6033 | 0.057 | -0.0199 | No | ||
| 15 | PTPRE | 1660286 2940095 | 7341 | 0.030 | -0.0890 | No | ||
| 16 | TCERG1L | 3360707 | 7373 | 0.029 | -0.0893 | No | ||
| 17 | KAZALD1 | 380603 | 7668 | 0.025 | -0.1041 | No | ||
| 18 | HR | 2690095 6200300 | 7711 | 0.024 | -0.1053 | No | ||
| 19 | BHLHB5 | 6510520 | 8000 | 0.020 | -0.1199 | No | ||
| 20 | CHN2 | 870528 | 8445 | 0.013 | -0.1433 | No | ||
| 21 | HOXA2 | 2120121 | 8839 | 0.007 | -0.1641 | No | ||
| 22 | GRIN2A | 6550538 | 9404 | -0.001 | -0.1945 | No | ||
| 23 | NR6A1 | 4010347 | 10000 | -0.009 | -0.2261 | No | ||
| 24 | DLL4 | 6400403 | 10363 | -0.014 | -0.2450 | No | ||
| 25 | SYT6 | 2510280 3850128 4540064 | 12659 | -0.059 | -0.3659 | No | ||
| 26 | FZD5 | 4070452 | 12720 | -0.061 | -0.3665 | No | ||
| 27 | FUCA1 | 610075 | 12748 | -0.062 | -0.3652 | No | ||
| 28 | RBM16 | 6290286 6400181 | 13020 | -0.071 | -0.3766 | No | ||
| 29 | FBXO5 | 2630551 | 13457 | -0.088 | -0.3962 | No | ||
| 30 | WNT1 | 4780148 | 13613 | -0.095 | -0.4003 | No | ||
| 31 | POU2F1 | 70577 430373 4850324 5910056 | 14174 | -0.127 | -0.4249 | No | ||
| 32 | PIGO | 1400528 2340026 5340097 | 14471 | -0.148 | -0.4342 | No | ||
| 33 | PSIP1 | 1780082 3190435 5050594 | 14740 | -0.172 | -0.4410 | No | ||
| 34 | BAI2 | 380632 630113 6650170 | 14795 | -0.178 | -0.4360 | No | ||
| 35 | KIF1B | 1240494 2370139 4570270 6510102 | 14873 | -0.185 | -0.4320 | No | ||
| 36 | GRIK3 | 6380592 | 14904 | -0.188 | -0.4253 | No | ||
| 37 | EIF2C1 | 6900551 | 14965 | -0.194 | -0.4199 | No | ||
| 38 | UBE2D3 | 3190452 | 16628 | -0.536 | -0.4857 | Yes | ||
| 39 | GLTSCR2 | 1940463 | 16838 | -0.603 | -0.4702 | Yes | ||
| 40 | DNAJC11 | 360465 3390215 | 17127 | -0.719 | -0.4538 | Yes | ||
| 41 | DUSP10 | 2850673 3360064 | 17249 | -0.770 | -0.4262 | Yes | ||
| 42 | RAB3IP | 5550100 | 17738 | -1.009 | -0.4077 | Yes | ||
| 43 | CAMTA2 | 3990075 | 17988 | -1.193 | -0.3682 | Yes | ||
| 44 | DHCR24 | 840600 1050672 6290097 | 18241 | -1.477 | -0.3163 | Yes | ||
| 45 | PTPRF | 1770528 3190044 | 18502 | -2.063 | -0.2388 | Yes | ||
| 46 | ACBD4 | 6980079 | 18558 | -2.339 | -0.1380 | Yes | ||
| 47 | HES1 | 4810280 | 18606 | -3.181 | 0.0005 | Yes |

