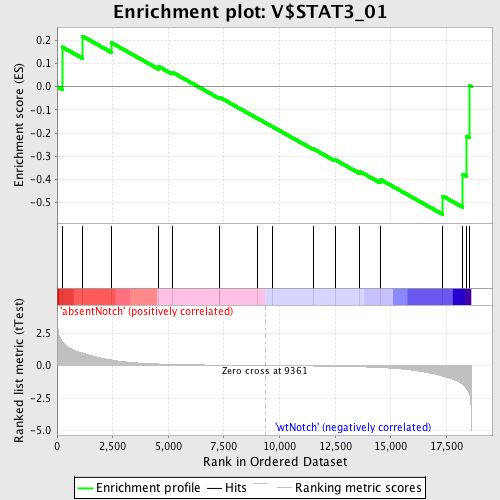
Profile of the Running ES Score & Positions of GeneSet Members on the Rank Ordered List
| Dataset | Set_03_absentNotch_versus_wtNotch.phenotype_absentNotch_versus_wtNotch.cls #absentNotch_versus_wtNotch.phenotype_absentNotch_versus_wtNotch.cls #absentNotch_versus_wtNotch_repos |
| Phenotype | phenotype_absentNotch_versus_wtNotch.cls#absentNotch_versus_wtNotch_repos |
| Upregulated in class | wtNotch |
| GeneSet | V$STAT3_01 |
| Enrichment Score (ES) | -0.5510595 |
| Normalized Enrichment Score (NES) | -1.1785414 |
| Nominal p-value | 0.24586777 |
| FDR q-value | 1.0 |
| FWER p-Value | 1.0 |
| PROBE | DESCRIPTION (from dataset) | GENE SYMBOL | GENE_TITLE | RANK IN GENE LIST | RANK METRIC SCORE | RUNNING ES | CORE ENRICHMENT | |
|---|---|---|---|---|---|---|---|---|
| 1 | CISH | 840315 | 228 | 1.866 | 0.1713 | No | ||
| 2 | ELMO1 | 110338 1190451 1580148 1850609 2350706 2370369 2450129 3840113 4150184 4280079 6290066 6380435 6770494 7100180 | 1133 | 0.970 | 0.2181 | No | ||
| 3 | SERPING1 | 5550440 | 2446 | 0.424 | 0.1893 | No | ||
| 4 | CCL2 | 4760019 | 4568 | 0.116 | 0.0867 | No | ||
| 5 | PROS1 | 5420465 | 5164 | 0.086 | 0.0632 | No | ||
| 6 | APBA1 | 3140487 | 7278 | 0.031 | -0.0474 | No | ||
| 7 | MAFF | 4850577 5720286 | 7284 | 0.031 | -0.0446 | No | ||
| 8 | SLC38A5 | 540093 | 9009 | 0.005 | -0.1368 | No | ||
| 9 | VIP | 2850647 | 9666 | -0.004 | -0.1717 | No | ||
| 10 | ZNF228 | 6020397 | 11507 | -0.033 | -0.2674 | No | ||
| 11 | UBR1 | 3800132 | 12492 | -0.055 | -0.3149 | No | ||
| 12 | HNRPR | 2320440 2900601 4610008 | 13599 | -0.094 | -0.3651 | No | ||
| 13 | CLDN5 | 6510717 | 14522 | -0.153 | -0.3996 | No | ||
| 14 | BTBD1 | 5720619 | 17340 | -0.804 | -0.4720 | Yes | ||
| 15 | IRF1 | 2340152 3450592 6290121 6980577 | 18222 | -1.450 | -0.3767 | Yes | ||
| 16 | TRAF4 | 3060041 4920528 6980286 | 18403 | -1.762 | -0.2131 | Yes | ||
| 17 | ICAM1 | 6980138 | 18551 | -2.282 | 0.0035 | Yes |

