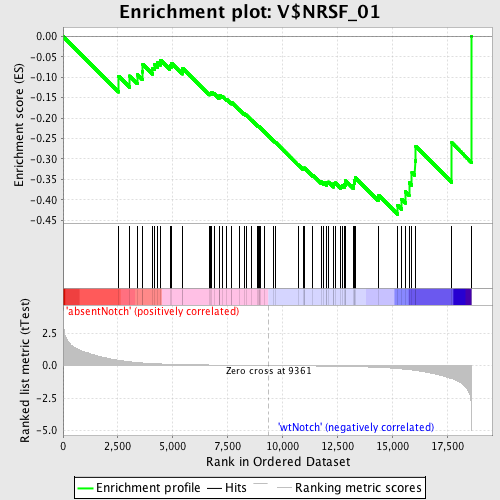
Profile of the Running ES Score & Positions of GeneSet Members on the Rank Ordered List
| Dataset | Set_03_absentNotch_versus_wtNotch.phenotype_absentNotch_versus_wtNotch.cls #absentNotch_versus_wtNotch.phenotype_absentNotch_versus_wtNotch.cls #absentNotch_versus_wtNotch_repos |
| Phenotype | phenotype_absentNotch_versus_wtNotch.cls#absentNotch_versus_wtNotch_repos |
| Upregulated in class | wtNotch |
| GeneSet | V$NRSF_01 |
| Enrichment Score (ES) | -0.43606058 |
| Normalized Enrichment Score (NES) | -1.2097212 |
| Nominal p-value | 0.1402715 |
| FDR q-value | 1.0 |
| FWER p-Value | 1.0 |
| PROBE | DESCRIPTION (from dataset) | GENE SYMBOL | GENE_TITLE | RANK IN GENE LIST | RANK METRIC SCORE | RUNNING ES | CORE ENRICHMENT | |
|---|---|---|---|---|---|---|---|---|
| 1 | NEFH | 630239 | 2530 | 0.403 | -0.0973 | No | ||
| 2 | CDKN2B | 6020040 | 3040 | 0.285 | -0.0970 | No | ||
| 3 | SNAP25 | 360520 | 3381 | 0.228 | -0.0932 | No | ||
| 4 | BARHL1 | 4210113 | 3611 | 0.198 | -0.0863 | No | ||
| 5 | DBC1 | 4610156 | 3633 | 0.196 | -0.0684 | No | ||
| 6 | GRIN1 | 3800014 7000609 | 4083 | 0.151 | -0.0780 | No | ||
| 7 | RASGRF1 | 730068 6940402 | 4163 | 0.144 | -0.0683 | No | ||
| 8 | DRD2 | 5890369 | 4314 | 0.133 | -0.0635 | No | ||
| 9 | SYT4 | 5080193 | 4445 | 0.124 | -0.0584 | No | ||
| 10 | TCF1 | 5390022 | 4871 | 0.099 | -0.0717 | No | ||
| 11 | FGD2 | 5340195 | 4940 | 0.096 | -0.0660 | No | ||
| 12 | PAQR4 | 730736 | 5428 | 0.076 | -0.0849 | No | ||
| 13 | TRIM9 | 1230672 2120162 6450100 6450687 | 5433 | 0.076 | -0.0777 | No | ||
| 14 | GHSR | 1980465 7050521 | 6657 | 0.043 | -0.1395 | No | ||
| 15 | DRD3 | 4780402 | 6719 | 0.041 | -0.1387 | No | ||
| 16 | GABRG2 | 2350402 4210204 6130279 6550037 | 6755 | 0.041 | -0.1366 | No | ||
| 17 | GRM1 | 5890324 | 6883 | 0.038 | -0.1398 | No | ||
| 18 | RNF13 | 2370021 | 7110 | 0.034 | -0.1487 | No | ||
| 19 | GLRA3 | 2570500 | 7125 | 0.034 | -0.1461 | No | ||
| 20 | CHGA | 1990056 6550463 | 7145 | 0.033 | -0.1439 | No | ||
| 21 | PTPRN | 5900577 | 7245 | 0.031 | -0.1462 | No | ||
| 22 | PCSK2 | 360017 430528 5900619 | 7458 | 0.028 | -0.1549 | No | ||
| 23 | PRG3 | 6220020 | 7659 | 0.025 | -0.1633 | No | ||
| 24 | CRYBA2 | 5900138 | 7679 | 0.025 | -0.1619 | No | ||
| 25 | GABRB3 | 4150164 | 8047 | 0.019 | -0.1799 | No | ||
| 26 | KCNIP2 | 60088 1780324 | 8257 | 0.015 | -0.1896 | No | ||
| 27 | SLC12A5 | 1980692 | 8335 | 0.015 | -0.1924 | No | ||
| 28 | HTR1A | 6980441 | 8604 | 0.011 | -0.2058 | No | ||
| 29 | CALB1 | 460070 | 8880 | 0.007 | -0.2200 | No | ||
| 30 | TNRC4 | 4050156 | 8906 | 0.006 | -0.2207 | No | ||
| 31 | GDAP1L1 | 1660066 | 8928 | 0.006 | -0.2213 | No | ||
| 32 | POU4F3 | 2690035 | 8956 | 0.005 | -0.2223 | No | ||
| 33 | SEZ6 | 3450722 | 9002 | 0.005 | -0.2242 | No | ||
| 34 | STMN2 | 6220181 | 9184 | 0.002 | -0.2337 | No | ||
| 35 | APBB1 | 2690338 | 9605 | -0.003 | -0.2561 | No | ||
| 36 | VIP | 2850647 | 9666 | -0.004 | -0.2589 | No | ||
| 37 | COL5A3 | 1940471 | 10737 | -0.020 | -0.3147 | No | ||
| 38 | CHAT | 6840603 | 10949 | -0.023 | -0.3238 | No | ||
| 39 | SLC17A6 | 4210576 | 10984 | -0.024 | -0.3233 | No | ||
| 40 | SCN3B | 840112 1780152 5910685 6100131 | 11006 | -0.024 | -0.3221 | No | ||
| 41 | RPH3A | 2190156 | 11387 | -0.031 | -0.3396 | No | ||
| 42 | ELAVL3 | 2850014 | 11765 | -0.038 | -0.3562 | No | ||
| 43 | HCN1 | 5130458 | 11883 | -0.040 | -0.3586 | No | ||
| 44 | SST | 6590142 | 12001 | -0.043 | -0.3608 | No | ||
| 45 | OMG | 6760066 | 12007 | -0.043 | -0.3569 | No | ||
| 46 | ATP6V0A1 | 1570082 3870441 4230044 | 12082 | -0.045 | -0.3565 | No | ||
| 47 | L1CAM | 4850021 | 12314 | -0.050 | -0.3641 | No | ||
| 48 | NPPB | 4150722 | 12341 | -0.051 | -0.3606 | No | ||
| 49 | MGAT5B | 380131 2570364 | 12400 | -0.052 | -0.3586 | No | ||
| 50 | SYT6 | 2510280 3850128 4540064 | 12659 | -0.059 | -0.3668 | No | ||
| 51 | ATP2B2 | 3780397 | 12731 | -0.061 | -0.3647 | No | ||
| 52 | BDNF | 2940128 3520368 | 12822 | -0.064 | -0.3633 | No | ||
| 53 | KCNH8 | 3940129 | 12874 | -0.066 | -0.3597 | No | ||
| 54 | FGF12 | 1740446 2360037 | 12880 | -0.066 | -0.3536 | No | ||
| 55 | PHYHIPL | 2360706 3840692 | 13243 | -0.079 | -0.3654 | No | ||
| 56 | POU4F2 | 2120195 2570022 | 13258 | -0.080 | -0.3584 | No | ||
| 57 | MAPK11 | 130452 3120440 3610465 | 13281 | -0.081 | -0.3517 | No | ||
| 58 | HTR5A | 1940253 | 13312 | -0.082 | -0.3454 | No | ||
| 59 | GLRA1 | 610575 | 14375 | -0.140 | -0.3890 | No | ||
| 60 | LHX3 | 670164 1770280 | 15249 | -0.229 | -0.4138 | Yes | ||
| 61 | SCAMP5 | 5550368 6290021 | 15426 | -0.255 | -0.3985 | Yes | ||
| 62 | DNER | 3610170 | 15608 | -0.287 | -0.3804 | Yes | ||
| 63 | CDK5R1 | 3870161 | 15770 | -0.314 | -0.3585 | Yes | ||
| 64 | CHKA | 510324 | 15898 | -0.340 | -0.3324 | Yes | ||
| 65 | CHRNB2 | 580204 3120739 | 16038 | -0.369 | -0.3041 | Yes | ||
| 66 | HCN3 | 3940438 6840750 | 16075 | -0.377 | -0.2694 | Yes | ||
| 67 | DDX25 | 5910121 | 17717 | -1.001 | -0.2606 | Yes | ||
| 68 | HES1 | 4810280 | 18606 | -3.181 | 0.0005 | Yes |

