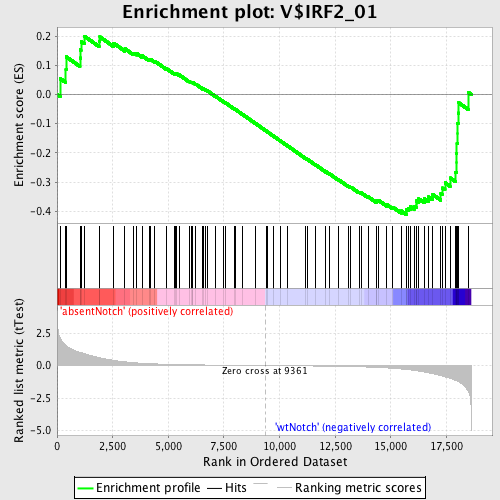
Profile of the Running ES Score & Positions of GeneSet Members on the Rank Ordered List
| Dataset | Set_03_absentNotch_versus_wtNotch.phenotype_absentNotch_versus_wtNotch.cls #absentNotch_versus_wtNotch.phenotype_absentNotch_versus_wtNotch.cls #absentNotch_versus_wtNotch_repos |
| Phenotype | phenotype_absentNotch_versus_wtNotch.cls#absentNotch_versus_wtNotch_repos |
| Upregulated in class | wtNotch |
| GeneSet | V$IRF2_01 |
| Enrichment Score (ES) | -0.4112948 |
| Normalized Enrichment Score (NES) | -1.1820359 |
| Nominal p-value | 0.14250614 |
| FDR q-value | 1.0 |
| FWER p-Value | 1.0 |
| PROBE | DESCRIPTION (from dataset) | GENE SYMBOL | GENE_TITLE | RANK IN GENE LIST | RANK METRIC SCORE | RUNNING ES | CORE ENRICHMENT | |
|---|---|---|---|---|---|---|---|---|
| 1 | MAPK6 | 6760520 | 138 | 2.130 | 0.0546 | No | ||
| 2 | USP18 | 4010110 | 397 | 1.542 | 0.0857 | No | ||
| 3 | VGLL4 | 6860463 | 408 | 1.524 | 0.1295 | No | ||
| 4 | SLC38A2 | 1470242 3800026 | 1029 | 1.006 | 0.1254 | No | ||
| 5 | B2M | 5080332 5130059 | 1051 | 1.000 | 0.1534 | No | ||
| 6 | EIF4A2 | 1170494 1740711 2850504 | 1076 | 0.997 | 0.1812 | No | ||
| 7 | PRDX5 | 1660592 2030091 | 1220 | 0.919 | 0.2003 | No | ||
| 8 | CDK6 | 4920253 | 1888 | 0.610 | 0.1821 | No | ||
| 9 | PIGR | 6520441 | 1923 | 0.594 | 0.1975 | No | ||
| 10 | ASH1L | 2510402 5360687 6650685 | 2533 | 0.403 | 0.1764 | No | ||
| 11 | DNASE1L3 | 670086 | 3050 | 0.283 | 0.1568 | No | ||
| 12 | KCNE4 | 2470102 | 3446 | 0.220 | 0.1419 | No | ||
| 13 | E2F3 | 50162 460180 | 3567 | 0.203 | 0.1414 | No | ||
| 14 | ATF3 | 1940546 | 3822 | 0.173 | 0.1327 | No | ||
| 15 | NDN | 5670075 | 4134 | 0.146 | 0.1202 | No | ||
| 16 | LDB2 | 5670441 6110170 | 4215 | 0.140 | 0.1200 | No | ||
| 17 | FXYD5 | 4060301 6590400 | 4398 | 0.127 | 0.1138 | No | ||
| 18 | NR3C2 | 2480324 6400093 | 4914 | 0.097 | 0.0889 | No | ||
| 19 | HOXA6 | 2340333 | 5273 | 0.082 | 0.0719 | No | ||
| 20 | THRAP1 | 2470121 | 5307 | 0.081 | 0.0725 | No | ||
| 21 | BNC2 | 4810603 | 5345 | 0.079 | 0.0728 | No | ||
| 22 | IFNB1 | 1400142 | 5485 | 0.075 | 0.0675 | No | ||
| 23 | ESR1 | 4060372 5860193 | 5942 | 0.060 | 0.0446 | No | ||
| 24 | RIMS2 | 670725 | 6034 | 0.057 | 0.0414 | No | ||
| 25 | LIF | 1410373 2060129 3990338 | 6070 | 0.056 | 0.0412 | No | ||
| 26 | PLXNC1 | 5860315 | 6101 | 0.056 | 0.0412 | No | ||
| 27 | CUL2 | 4200278 | 6239 | 0.053 | 0.0353 | No | ||
| 28 | PDGFC | 4200133 | 6556 | 0.045 | 0.0196 | No | ||
| 29 | BLK | 1940128 5390053 | 6573 | 0.044 | 0.0200 | No | ||
| 30 | ARHGAP5 | 2510619 3360035 | 6683 | 0.042 | 0.0153 | No | ||
| 31 | HPCAL1 | 1980129 2350348 | 6738 | 0.041 | 0.0136 | No | ||
| 32 | PGM5 | 2340446 | 7129 | 0.034 | -0.0064 | No | ||
| 33 | MCM8 | 6130743 | 7491 | 0.027 | -0.0251 | No | ||
| 34 | PSMA3 | 5900047 7040161 | 7567 | 0.026 | -0.0284 | No | ||
| 35 | IL27 | 1990324 | 7973 | 0.020 | -0.0497 | No | ||
| 36 | BHLHB5 | 6510520 | 8000 | 0.020 | -0.0505 | No | ||
| 37 | PRDM16 | 4120541 | 8354 | 0.014 | -0.0691 | No | ||
| 38 | ASPA | 3290400 | 8909 | 0.006 | -0.0988 | No | ||
| 39 | MITF | 380056 | 9394 | -0.000 | -0.1249 | No | ||
| 40 | CXCL10 | 2450408 | 9447 | -0.001 | -0.1277 | No | ||
| 41 | PROX1 | 4210193 | 9706 | -0.004 | -0.1415 | No | ||
| 42 | DLX4 | 50215 6650059 | 10037 | -0.009 | -0.1590 | No | ||
| 43 | NPR3 | 1580239 | 10335 | -0.014 | -0.1747 | No | ||
| 44 | IL11 | 1740398 | 11183 | -0.027 | -0.2196 | No | ||
| 45 | RFX4 | 3710100 5340215 | 11274 | -0.028 | -0.2236 | No | ||
| 46 | MSX1 | 2650309 | 11603 | -0.035 | -0.2403 | No | ||
| 47 | UBD | 5570632 | 12083 | -0.045 | -0.2648 | No | ||
| 48 | TBX1 | 3710133 6590121 | 12225 | -0.048 | -0.2711 | No | ||
| 49 | EGFL6 | 3940181 | 12637 | -0.058 | -0.2915 | No | ||
| 50 | USF1 | 4280156 4610114 6370113 | 13105 | -0.074 | -0.3146 | No | ||
| 51 | OTX1 | 2510215 | 13194 | -0.077 | -0.3171 | No | ||
| 52 | TRPM3 | 2470110 6400731 6550047 | 13575 | -0.093 | -0.3349 | No | ||
| 53 | TMPRSS5 | 4060068 | 13673 | -0.098 | -0.3372 | No | ||
| 54 | MAP3K11 | 7000039 | 13987 | -0.115 | -0.3508 | No | ||
| 55 | TNFSF13B | 1940438 6510441 | 14363 | -0.140 | -0.3669 | No | ||
| 56 | GLRA1 | 610575 | 14375 | -0.140 | -0.3634 | No | ||
| 57 | NT5C3 | 1570075 | 14462 | -0.147 | -0.3638 | No | ||
| 58 | BBX | 6520112 | 14821 | -0.180 | -0.3779 | No | ||
| 59 | BCL11A | 6860369 | 15093 | -0.209 | -0.3864 | No | ||
| 60 | TERF2IP | 580010 870364 2190358 | 15470 | -0.263 | -0.3990 | No | ||
| 61 | DLG1 | 2630091 6020286 | 15699 | -0.302 | -0.4025 | Yes | ||
| 62 | DDX58 | 2450075 | 15701 | -0.303 | -0.3937 | Yes | ||
| 63 | CSAD | 770215 | 15802 | -0.322 | -0.3897 | Yes | ||
| 64 | DAP3 | 1660528 2120039 5420593 | 15882 | -0.337 | -0.3842 | Yes | ||
| 65 | REL | 360707 | 16049 | -0.371 | -0.3823 | Yes | ||
| 66 | TGFB3 | 1070041 | 16150 | -0.396 | -0.3762 | Yes | ||
| 67 | BST2 | 6760487 | 16151 | -0.396 | -0.3646 | Yes | ||
| 68 | PSMB8 | 2850707 | 16254 | -0.424 | -0.3578 | Yes | ||
| 69 | DLX1 | 360168 | 16507 | -0.493 | -0.3570 | Yes | ||
| 70 | SIPA1 | 5220687 | 16698 | -0.559 | -0.3510 | Yes | ||
| 71 | USP5 | 4850017 | 16882 | -0.616 | -0.3429 | Yes | ||
| 72 | DUSP10 | 2850673 3360064 | 17249 | -0.770 | -0.3402 | Yes | ||
| 73 | IL15RA | 2570270 3190711 6100091 6100270 | 17309 | -0.790 | -0.3204 | Yes | ||
| 74 | TAP1 | 4050047 | 17437 | -0.854 | -0.3023 | Yes | ||
| 75 | ARHGEF6 | 4780164 6380450 | 17666 | -0.984 | -0.2859 | Yes | ||
| 76 | ROCK1 | 130044 | 17902 | -1.127 | -0.2658 | Yes | ||
| 77 | UPF2 | 4810471 | 17961 | -1.173 | -0.2347 | Yes | ||
| 78 | GSDMDC1 | 4010092 5050091 | 17963 | -1.174 | -0.2005 | Yes | ||
| 79 | PSME1 | 450193 4480035 | 17973 | -1.183 | -0.1665 | Yes | ||
| 80 | KARS | 6520575 | 18004 | -1.205 | -0.1330 | Yes | ||
| 81 | BAT5 | 5720687 | 18006 | -1.206 | -0.0979 | Yes | ||
| 82 | TCIRG1 | 4590524 5910079 6900619 | 18026 | -1.223 | -0.0633 | Yes | ||
| 83 | TAPBP | 1980110 | 18055 | -1.248 | -0.0284 | Yes | ||
| 84 | PSMB9 | 6980471 | 18481 | -2.011 | 0.0073 | Yes |

