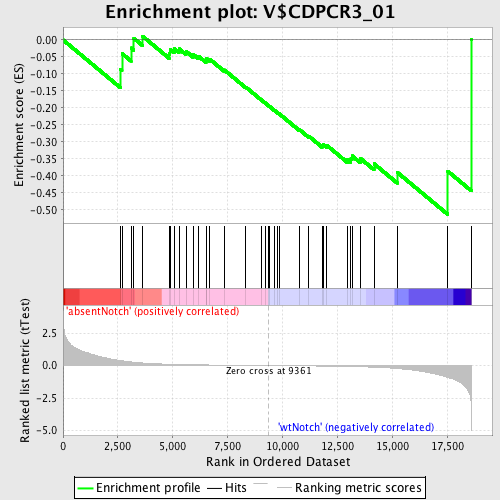
Profile of the Running ES Score & Positions of GeneSet Members on the Rank Ordered List
| Dataset | Set_03_absentNotch_versus_wtNotch.phenotype_absentNotch_versus_wtNotch.cls #absentNotch_versus_wtNotch.phenotype_absentNotch_versus_wtNotch.cls #absentNotch_versus_wtNotch_repos |
| Phenotype | phenotype_absentNotch_versus_wtNotch.cls#absentNotch_versus_wtNotch_repos |
| Upregulated in class | wtNotch |
| GeneSet | V$CDPCR3_01 |
| Enrichment Score (ES) | -0.51366097 |
| Normalized Enrichment Score (NES) | -1.2715942 |
| Nominal p-value | 0.104166664 |
| FDR q-value | 1.0 |
| FWER p-Value | 1.0 |
| PROBE | DESCRIPTION (from dataset) | GENE SYMBOL | GENE_TITLE | RANK IN GENE LIST | RANK METRIC SCORE | RUNNING ES | CORE ENRICHMENT | |
|---|---|---|---|---|---|---|---|---|
| 1 | SP6 | 60484 510452 2690333 | 2610 | 0.384 | -0.0868 | No | ||
| 2 | ETV3 | 5360487 | 2684 | 0.363 | -0.0400 | No | ||
| 3 | PPARG | 1990168 2680603 6130632 | 3098 | 0.276 | -0.0236 | No | ||
| 4 | IRAK1 | 4120593 | 3224 | 0.251 | 0.0047 | No | ||
| 5 | MARK1 | 450484 | 3618 | 0.198 | 0.0112 | No | ||
| 6 | CNTN6 | 2630711 | 4833 | 0.100 | -0.0401 | No | ||
| 7 | TCF1 | 5390022 | 4871 | 0.099 | -0.0282 | No | ||
| 8 | CSMD3 | 1660427 1940687 | 5061 | 0.091 | -0.0257 | No | ||
| 9 | HOXA4 | 940152 | 5284 | 0.081 | -0.0263 | No | ||
| 10 | PAK3 | 4210136 | 5602 | 0.071 | -0.0335 | No | ||
| 11 | RBPMS | 3990494 | 5924 | 0.061 | -0.0423 | No | ||
| 12 | LPHN2 | 4480010 | 6168 | 0.054 | -0.0478 | No | ||
| 13 | DLX5 | 5130519 6040021 | 6515 | 0.046 | -0.0601 | No | ||
| 14 | FOXB1 | 4920270 5290463 | 6540 | 0.045 | -0.0550 | No | ||
| 15 | PIP5K1A | 4560672 | 6681 | 0.042 | -0.0567 | No | ||
| 16 | SIX3 | 3830402 | 7350 | 0.030 | -0.0884 | No | ||
| 17 | NTN1 | 5700600 | 8326 | 0.015 | -0.1389 | No | ||
| 18 | SPP2 | 3840253 | 9034 | 0.004 | -0.1763 | No | ||
| 19 | NFIA | 2760129 5860278 | 9224 | 0.002 | -0.1862 | No | ||
| 20 | FGF7 | 5390484 | 9359 | 0.000 | -0.1934 | No | ||
| 21 | FGF10 | 730458 840706 | 9415 | -0.001 | -0.1963 | No | ||
| 22 | CRH | 3710301 | 9633 | -0.004 | -0.2074 | No | ||
| 23 | CER1 | 840102 | 9778 | -0.005 | -0.2144 | No | ||
| 24 | SIX1 | 6760471 | 9850 | -0.006 | -0.2174 | No | ||
| 25 | BHLHB3 | 3450438 | 10774 | -0.020 | -0.2642 | No | ||
| 26 | MYT1 | 6770524 | 11193 | -0.027 | -0.2829 | No | ||
| 27 | UPP2 | 2190091 2680746 6940647 | 11802 | -0.039 | -0.3102 | No | ||
| 28 | PTGFRN | 4120524 | 11852 | -0.040 | -0.3073 | No | ||
| 29 | ZIC1 | 670113 | 12018 | -0.043 | -0.3102 | No | ||
| 30 | BMP4 | 380113 | 12965 | -0.069 | -0.3515 | No | ||
| 31 | CDK2AP1 | 2340156 | 13120 | -0.075 | -0.3493 | No | ||
| 32 | POU3F4 | 870274 | 13169 | -0.077 | -0.3412 | No | ||
| 33 | NPAS1 | 5570020 | 13544 | -0.092 | -0.3484 | No | ||
| 34 | POU2F1 | 70577 430373 4850324 5910056 | 14174 | -0.127 | -0.3646 | No | ||
| 35 | ZIC4 | 1500082 | 15230 | -0.226 | -0.3897 | Yes | ||
| 36 | L3MBTL2 | 6020341 | 17534 | -0.910 | -0.3865 | Yes | ||
| 37 | HES1 | 4810280 | 18606 | -3.181 | 0.0005 | Yes |

