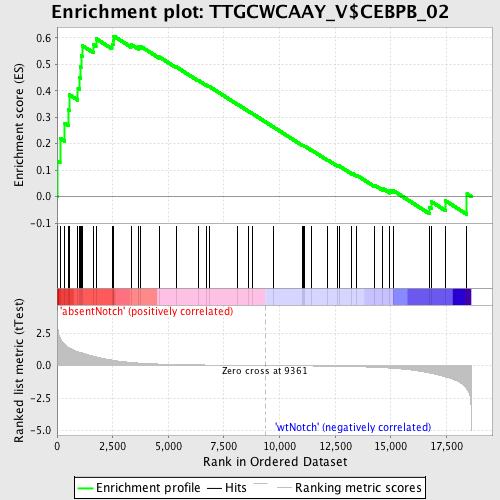
Profile of the Running ES Score & Positions of GeneSet Members on the Rank Ordered List
| Dataset | Set_03_absentNotch_versus_wtNotch.phenotype_absentNotch_versus_wtNotch.cls #absentNotch_versus_wtNotch.phenotype_absentNotch_versus_wtNotch.cls #absentNotch_versus_wtNotch_repos |
| Phenotype | phenotype_absentNotch_versus_wtNotch.cls#absentNotch_versus_wtNotch_repos |
| Upregulated in class | absentNotch |
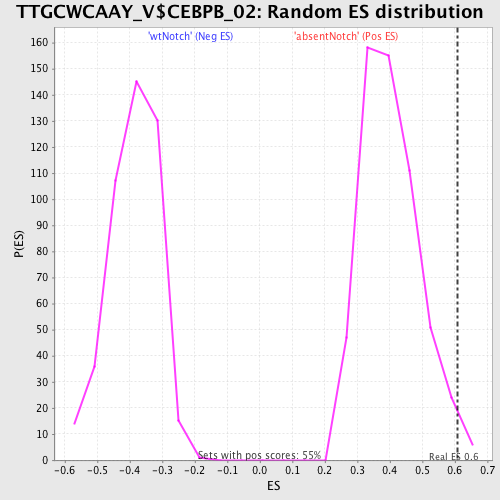
| GeneSet | TTGCWCAAY_V$CEBPB_02 |
| Enrichment Score (ES) | 0.6066 |
| Normalized Enrichment Score (NES) | 1.5101185 |
| Nominal p-value | 0.018115941 |
| FDR q-value | 0.16798005 |
| FWER p-Value | 0.88 |
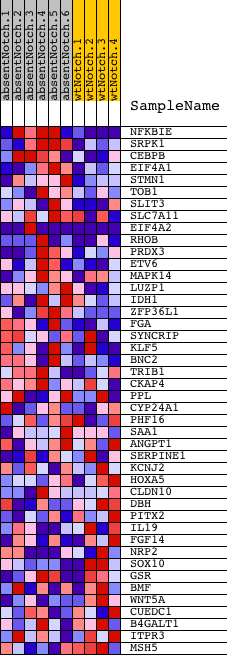
| PROBE | DESCRIPTION (from dataset) | GENE SYMBOL | GENE_TITLE | RANK IN GENE LIST | RANK METRIC SCORE | RUNNING ES | CORE ENRICHMENT | |
|---|---|---|---|---|---|---|---|---|
| 1 | NFKBIE | 580390 2190086 | 18 | 3.130 | 0.1337 | Yes | ||
| 2 | SRPK1 | 450110 | 132 | 2.155 | 0.2204 | Yes | ||
| 3 | CEBPB | 2970019 | 348 | 1.593 | 0.2773 | Yes | ||
| 4 | EIF4A1 | 1990341 2810300 | 512 | 1.391 | 0.3284 | Yes | ||
| 5 | STMN1 | 1990717 | 548 | 1.364 | 0.3852 | Yes | ||
| 6 | TOB1 | 4150138 | 937 | 1.057 | 0.4098 | Yes | ||
| 7 | SLIT3 | 7100132 | 1012 | 1.015 | 0.4495 | Yes | ||
| 8 | SLC7A11 | 2850138 | 1049 | 1.000 | 0.4906 | Yes | ||
| 9 | EIF4A2 | 1170494 1740711 2850504 | 1076 | 0.997 | 0.5321 | Yes | ||
| 10 | RHOB | 1500309 | 1148 | 0.964 | 0.5698 | Yes | ||
| 11 | PRDX3 | 1690035 | 1625 | 0.717 | 0.5750 | Yes | ||
| 12 | ETV6 | 610524 | 1750 | 0.666 | 0.5970 | Yes | ||
| 13 | MAPK14 | 5290731 | 2468 | 0.418 | 0.5763 | Yes | ||
| 14 | LUZP1 | 940075 4280458 6180070 | 2526 | 0.403 | 0.5906 | Yes | ||
| 15 | IDH1 | 1990021 | 2549 | 0.399 | 0.6066 | Yes | ||
| 16 | ZFP36L1 | 2510138 4120048 | 3322 | 0.236 | 0.5752 | No | ||
| 17 | FGA | 4210056 5220239 | 3653 | 0.193 | 0.5658 | No | ||
| 18 | SYNCRIP | 1690195 3140113 4670279 | 3755 | 0.182 | 0.5681 | No | ||
| 19 | KLF5 | 3840348 | 4594 | 0.115 | 0.5280 | No | ||
| 20 | BNC2 | 4810603 | 5345 | 0.079 | 0.4910 | No | ||
| 21 | TRIB1 | 2320435 | 6344 | 0.050 | 0.4394 | No | ||
| 22 | CKAP4 | 1050056 | 6702 | 0.042 | 0.4220 | No | ||
| 23 | PPL | 2360072 | 6839 | 0.039 | 0.4164 | No | ||
| 24 | CYP24A1 | 2340338 | 8123 | 0.018 | 0.3480 | No | ||
| 25 | PHF16 | 50373 7200161 | 8617 | 0.010 | 0.3219 | No | ||
| 26 | SAA1 | 5390520 | 8797 | 0.008 | 0.3126 | No | ||
| 27 | ANGPT1 | 3990368 5130288 6770035 | 9731 | -0.005 | 0.2626 | No | ||
| 28 | SERPINE1 | 4210403 | 11026 | -0.025 | 0.1940 | No | ||
| 29 | KCNJ2 | 630019 | 11071 | -0.025 | 0.1927 | No | ||
| 30 | HOXA5 | 6840026 | 11134 | -0.026 | 0.1905 | No | ||
| 31 | CLDN10 | 4070364 4590059 4920097 5080687 6620270 | 11424 | -0.031 | 0.1763 | No | ||
| 32 | DBH | 3610458 | 12168 | -0.047 | 0.1383 | No | ||
| 33 | PITX2 | 870537 2690139 | 12609 | -0.058 | 0.1171 | No | ||
| 34 | IL19 | 6040142 | 12672 | -0.059 | 0.1163 | No | ||
| 35 | FGF14 | 2630390 3520075 6770048 | 13250 | -0.079 | 0.0886 | No | ||
| 36 | NRP2 | 4070400 5860041 6650446 | 13477 | -0.089 | 0.0803 | No | ||
| 37 | SOX10 | 6200538 | 14283 | -0.134 | 0.0427 | No | ||
| 38 | GSR | 3520079 | 14640 | -0.164 | 0.0306 | No | ||
| 39 | BMF | 610102 | 14958 | -0.193 | 0.0218 | No | ||
| 40 | WNT5A | 840685 3120152 | 15104 | -0.211 | 0.0231 | No | ||
| 41 | CUEDC1 | 1660463 | 16723 | -0.566 | -0.0397 | No | ||
| 42 | B4GALT1 | 6980167 | 16840 | -0.604 | -0.0199 | No | ||
| 43 | ITPR3 | 4010632 | 17463 | -0.873 | -0.0159 | No | ||
| 44 | MSH5 | 1340019 4730333 | 18423 | -1.810 | 0.0104 | No |