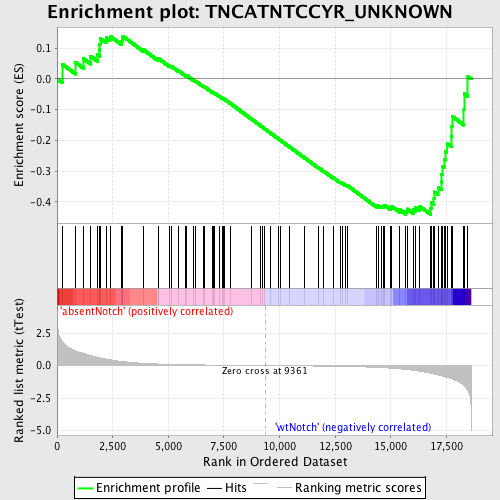
Profile of the Running ES Score & Positions of GeneSet Members on the Rank Ordered List
| Dataset | Set_03_absentNotch_versus_wtNotch.phenotype_absentNotch_versus_wtNotch.cls #absentNotch_versus_wtNotch.phenotype_absentNotch_versus_wtNotch.cls #absentNotch_versus_wtNotch_repos |
| Phenotype | phenotype_absentNotch_versus_wtNotch.cls#absentNotch_versus_wtNotch_repos |
| Upregulated in class | wtNotch |
| GeneSet | TNCATNTCCYR_UNKNOWN |
| Enrichment Score (ES) | -0.44121772 |
| Normalized Enrichment Score (NES) | -1.2381412 |
| Nominal p-value | 0.09832134 |
| FDR q-value | 1.0 |
| FWER p-Value | 1.0 |
| PROBE | DESCRIPTION (from dataset) | GENE SYMBOL | GENE_TITLE | RANK IN GENE LIST | RANK METRIC SCORE | RUNNING ES | CORE ENRICHMENT | |
|---|---|---|---|---|---|---|---|---|
| 1 | GSPT1 | 5420050 | 240 | 1.825 | 0.0477 | No | ||
| 2 | COX7C | 2470047 | 826 | 1.143 | 0.0541 | No | ||
| 3 | NTAN1 | 3440593 | 1194 | 0.940 | 0.0656 | No | ||
| 4 | MAP2K6 | 1230056 2940204 | 1511 | 0.770 | 0.0741 | No | ||
| 5 | TTC1 | 5890736 | 1808 | 0.639 | 0.0794 | No | ||
| 6 | EBI2 | 6220722 | 1900 | 0.607 | 0.0947 | No | ||
| 7 | CREBL1 | 1340546 | 1917 | 0.600 | 0.1137 | No | ||
| 8 | SLC35B4 | 6550170 | 1960 | 0.580 | 0.1308 | No | ||
| 9 | RDH11 | 4810673 | 2206 | 0.498 | 0.1341 | No | ||
| 10 | APBA3 | 2510348 | 2378 | 0.442 | 0.1396 | No | ||
| 11 | TSTA3 | 1230100 | 2909 | 0.312 | 0.1214 | No | ||
| 12 | FYN | 2100468 4760520 4850687 | 2920 | 0.311 | 0.1311 | No | ||
| 13 | COX7B | 2340504 | 2957 | 0.302 | 0.1392 | No | ||
| 14 | MRPL34 | 3520605 | 3884 | 0.168 | 0.0949 | No | ||
| 15 | PSMC3 | 2480184 | 4540 | 0.118 | 0.0634 | No | ||
| 16 | KLF12 | 1660095 4810288 5340546 6520286 | 4562 | 0.117 | 0.0662 | No | ||
| 17 | CSMD3 | 1660427 1940687 | 5061 | 0.091 | 0.0423 | No | ||
| 18 | CALR3 | 60601 3840088 5570592 6020139 | 5146 | 0.087 | 0.0407 | No | ||
| 19 | NT5C1B | 380050 | 5461 | 0.075 | 0.0263 | No | ||
| 20 | FEM1A | 6520091 | 5789 | 0.065 | 0.0108 | No | ||
| 21 | LMO4 | 3800746 | 5835 | 0.064 | 0.0105 | No | ||
| 22 | RASGRP3 | 6020504 | 6121 | 0.055 | -0.0031 | No | ||
| 23 | SOX12 | 1780037 | 6225 | 0.053 | -0.0069 | No | ||
| 24 | P2RX3 | 4230397 | 6574 | 0.044 | -0.0242 | No | ||
| 25 | MRPL54 | 870403 | 6633 | 0.043 | -0.0259 | No | ||
| 26 | SNAPC3 | 2360563 6200408 6650167 | 6973 | 0.037 | -0.0429 | No | ||
| 27 | BET1 | 4010725 | 7050 | 0.035 | -0.0459 | No | ||
| 28 | PTPN11 | 2230100 2470180 6100528 | 7089 | 0.034 | -0.0468 | No | ||
| 29 | SMPD3 | 520164 | 7310 | 0.030 | -0.0576 | No | ||
| 30 | MLLT7 | 4480707 | 7427 | 0.029 | -0.0629 | No | ||
| 31 | ADAM22 | 5390368 | 7488 | 0.028 | -0.0653 | No | ||
| 32 | OPHN1 | 2360100 | 7515 | 0.027 | -0.0658 | No | ||
| 33 | FOXA3 | 2680121 | 7774 | 0.023 | -0.0789 | No | ||
| 34 | SDPR | 3360292 | 8749 | 0.008 | -0.1312 | No | ||
| 35 | STX16 | 70315 | 9141 | 0.003 | -0.1522 | No | ||
| 36 | WNT3 | 2360685 | 9218 | 0.002 | -0.1562 | No | ||
| 37 | CPEB3 | 3940164 | 9319 | 0.000 | -0.1616 | No | ||
| 38 | HOXD1 | 7000458 | 9593 | -0.003 | -0.1762 | No | ||
| 39 | IPO7 | 2190746 | 9935 | -0.008 | -0.1943 | No | ||
| 40 | LRRTM3 | 4210021 | 10023 | -0.009 | -0.1987 | No | ||
| 41 | HOXC12 | 5270411 | 10437 | -0.015 | -0.2205 | No | ||
| 42 | HOXA5 | 6840026 | 11134 | -0.026 | -0.2572 | No | ||
| 43 | NR4A3 | 2900021 5860095 5910039 | 11751 | -0.038 | -0.2891 | No | ||
| 44 | COL6A3 | 2640717 4070064 5390717 | 11989 | -0.043 | -0.3005 | No | ||
| 45 | CD96 | 2320048 | 12410 | -0.053 | -0.3214 | No | ||
| 46 | CASK | 2340215 3290576 6770215 | 12729 | -0.061 | -0.3365 | No | ||
| 47 | BDNF | 2940128 3520368 | 12822 | -0.064 | -0.3394 | No | ||
| 48 | HSD17B4 | 4780504 | 12973 | -0.069 | -0.3452 | No | ||
| 49 | TLR7 | 3140300 | 13042 | -0.072 | -0.3465 | No | ||
| 50 | MADD | 6100725 7000088 | 14350 | -0.139 | -0.4123 | No | ||
| 51 | MRPL50 | 1740465 | 14454 | -0.147 | -0.4130 | No | ||
| 52 | TLE4 | 1450064 1500519 | 14571 | -0.158 | -0.4140 | No | ||
| 53 | ERG | 50154 1770739 | 14665 | -0.166 | -0.4136 | No | ||
| 54 | COVA1 | 5340504 5360594 | 14713 | -0.169 | -0.4105 | No | ||
| 55 | DDX47 | 1340133 3870152 6620647 | 14996 | -0.197 | -0.4191 | No | ||
| 56 | BIN1 | 5420348 5670500 | 15033 | -0.201 | -0.4144 | No | ||
| 57 | WWOX | 510008 870524 1090114 | 15401 | -0.251 | -0.4258 | No | ||
| 58 | HDAC8 | 3440504 | 15663 | -0.296 | -0.4301 | Yes | ||
| 59 | UBE2N | 520369 2900047 | 15728 | -0.307 | -0.4233 | Yes | ||
| 60 | PAX2 | 6040270 7000133 | 16006 | -0.363 | -0.4262 | Yes | ||
| 61 | PRKRIP1 | 4280746 6100390 | 16091 | -0.381 | -0.4180 | Yes | ||
| 62 | PCQAP | 3060064 6200273 | 16306 | -0.439 | -0.4150 | Yes | ||
| 63 | PIK3CG | 5890110 | 16793 | -0.589 | -0.4216 | Yes | ||
| 64 | POLR1B | 510315 | 16813 | -0.596 | -0.4028 | Yes | ||
| 65 | DFFA | 2850215 | 16938 | -0.639 | -0.3883 | Yes | ||
| 66 | HMG20A | 4590113 | 16959 | -0.646 | -0.3679 | Yes | ||
| 67 | AGTRAP | 6130180 | 17121 | -0.717 | -0.3528 | Yes | ||
| 68 | PPP2R5B | 2900441 | 17277 | -0.778 | -0.3353 | Yes | ||
| 69 | GSK3A | 3140735 | 17282 | -0.779 | -0.3096 | Yes | ||
| 70 | TMEM4 | 6220091 | 17315 | -0.793 | -0.2850 | Yes | ||
| 71 | VPS41 | 770056 4730471 | 17395 | -0.833 | -0.2615 | Yes | ||
| 72 | FKBPL | 6550592 | 17441 | -0.860 | -0.2354 | Yes | ||
| 73 | DTX2 | 4210041 7000008 | 17525 | -0.904 | -0.2098 | Yes | ||
| 74 | DDX25 | 5910121 | 17717 | -1.001 | -0.1869 | Yes | ||
| 75 | DPYSL2 | 2100427 3130112 5700324 | 17736 | -1.007 | -0.1543 | Yes | ||
| 76 | MEN1 | 4850300 5900671 | 17752 | -1.020 | -0.1212 | Yes | ||
| 77 | AAMP | 2640059 | 18287 | -1.551 | -0.0985 | Yes | ||
| 78 | DEF6 | 840593 | 18292 | -1.555 | -0.0470 | Yes | ||
| 79 | PDE6D | 3130537 3390014 | 18465 | -1.939 | 0.0081 | Yes |

