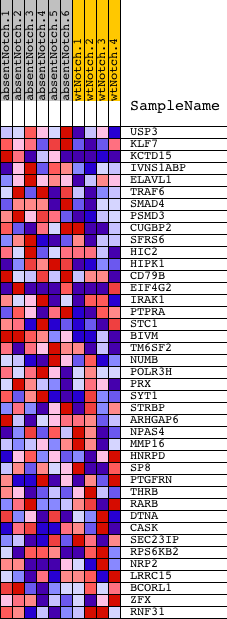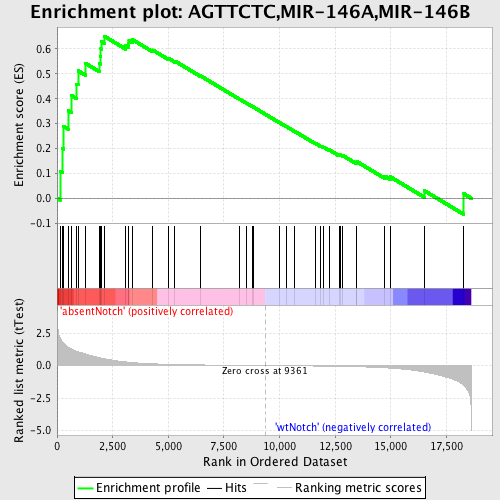
Profile of the Running ES Score & Positions of GeneSet Members on the Rank Ordered List
| Dataset | Set_03_absentNotch_versus_wtNotch.phenotype_absentNotch_versus_wtNotch.cls #absentNotch_versus_wtNotch.phenotype_absentNotch_versus_wtNotch.cls #absentNotch_versus_wtNotch_repos |
| Phenotype | phenotype_absentNotch_versus_wtNotch.cls#absentNotch_versus_wtNotch_repos |
| Upregulated in class | absentNotch |
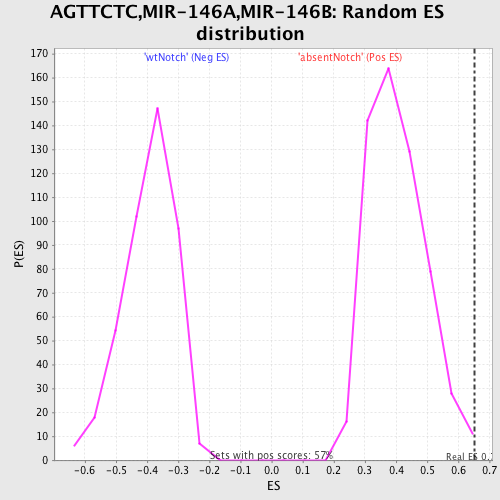
| GeneSet | AGTTCTC,MIR-146A,MIR-146B |
| Enrichment Score (ES) | 0.65152717 |
| Normalized Enrichment Score (NES) | 1.6122253 |
| Nominal p-value | 0.0017574693 |
| FDR q-value | 0.16256583 |
| FWER p-Value | 0.399 |
| PROBE | DESCRIPTION (from dataset) | GENE SYMBOL | GENE_TITLE | RANK IN GENE LIST | RANK METRIC SCORE | RUNNING ES | CORE ENRICHMENT | |
|---|---|---|---|---|---|---|---|---|
| 1 | USP3 | 2060332 | 133 | 2.154 | 0.1086 | Yes | ||
| 2 | KLF7 | 50390 | 241 | 1.820 | 0.2006 | Yes | ||
| 3 | KCTD15 | 2810735 | 297 | 1.691 | 0.2885 | Yes | ||
| 4 | IVNS1ABP | 4760601 6520113 | 514 | 1.389 | 0.3516 | Yes | ||
| 5 | ELAVL1 | 4730497 | 643 | 1.270 | 0.4129 | Yes | ||
| 6 | TRAF6 | 4810292 6200132 | 883 | 1.095 | 0.4589 | Yes | ||
| 7 | SMAD4 | 5670519 | 943 | 1.053 | 0.5123 | Yes | ||
| 8 | PSMD3 | 1400647 | 1271 | 0.887 | 0.5424 | Yes | ||
| 9 | CUGBP2 | 6180121 6840139 | 1903 | 0.606 | 0.5409 | Yes | ||
| 10 | SFRS6 | 60224 | 1934 | 0.590 | 0.5710 | Yes | ||
| 11 | HIC2 | 4010433 | 1968 | 0.577 | 0.6002 | Yes | ||
| 12 | HIPK1 | 110193 | 1996 | 0.569 | 0.6294 | Yes | ||
| 13 | CD79B | 1450066 3390358 | 2113 | 0.528 | 0.6515 | Yes | ||
| 14 | EIF4G2 | 3800575 6860184 | 3081 | 0.278 | 0.6144 | No | ||
| 15 | IRAK1 | 4120593 | 3224 | 0.251 | 0.6202 | No | ||
| 16 | PTPRA | 7100110 | 3229 | 0.251 | 0.6335 | No | ||
| 17 | STC1 | 360161 | 3377 | 0.228 | 0.6379 | No | ||
| 18 | BIVM | 6040546 | 4293 | 0.134 | 0.5958 | No | ||
| 19 | TM6SF2 | 6770204 | 5021 | 0.092 | 0.5616 | No | ||
| 20 | NUMB | 2450735 3800253 6350040 | 5296 | 0.081 | 0.5512 | No | ||
| 21 | POLR3H | 1980369 6400348 | 6429 | 0.048 | 0.4929 | No | ||
| 22 | PRX | 2260400 4200347 | 8204 | 0.016 | 0.3982 | No | ||
| 23 | SYT1 | 840364 | 8531 | 0.012 | 0.3813 | No | ||
| 24 | STRBP | 4210594 5360239 | 8793 | 0.008 | 0.3677 | No | ||
| 25 | ARHGAP6 | 2060121 | 8804 | 0.008 | 0.3675 | No | ||
| 26 | NPAS4 | 2320204 4150154 | 9999 | -0.009 | 0.3037 | No | ||
| 27 | MMP16 | 2680139 | 10305 | -0.013 | 0.2880 | No | ||
| 28 | HNRPD | 4120021 | 10669 | -0.019 | 0.2695 | No | ||
| 29 | SP8 | 4060576 | 11602 | -0.035 | 0.2212 | No | ||
| 30 | PTGFRN | 4120524 | 11852 | -0.040 | 0.2099 | No | ||
| 31 | THRB | 1780673 | 11988 | -0.043 | 0.2049 | No | ||
| 32 | RARB | 430139 1410138 | 12233 | -0.048 | 0.1944 | No | ||
| 33 | DTNA | 1340600 1780731 2340278 2850132 | 12677 | -0.060 | 0.1737 | No | ||
| 34 | CASK | 2340215 3290576 6770215 | 12729 | -0.061 | 0.1743 | No | ||
| 35 | SEC23IP | 4540484 6200047 | 12837 | -0.064 | 0.1720 | No | ||
| 36 | RPS6KB2 | 6220600 | 13464 | -0.088 | 0.1430 | No | ||
| 37 | NRP2 | 4070400 5860041 6650446 | 13477 | -0.089 | 0.1472 | No | ||
| 38 | LRRC15 | 3940609 | 14723 | -0.170 | 0.0893 | No | ||
| 39 | BCORL1 | 1660008 | 14970 | -0.194 | 0.0865 | No | ||
| 40 | ZFX | 5900400 | 16521 | -0.498 | 0.0298 | No | ||
| 41 | RNF31 | 110035 | 18284 | -1.543 | 0.0179 | No |