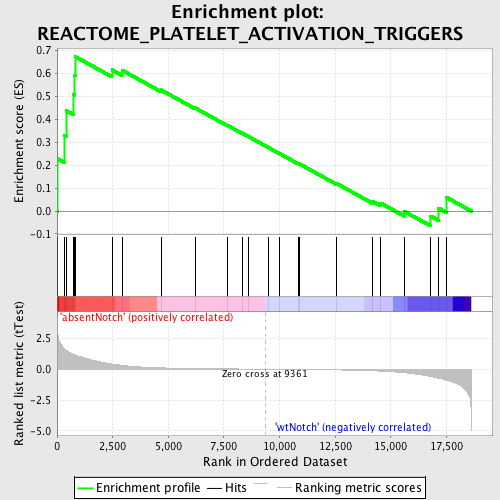
Profile of the Running ES Score & Positions of GeneSet Members on the Rank Ordered List
| Dataset | Set_03_absentNotch_versus_wtNotch.phenotype_absentNotch_versus_wtNotch.cls #absentNotch_versus_wtNotch.phenotype_absentNotch_versus_wtNotch.cls #absentNotch_versus_wtNotch_repos |
| Phenotype | phenotype_absentNotch_versus_wtNotch.cls#absentNotch_versus_wtNotch_repos |
| Upregulated in class | absentNotch |
| GeneSet | REACTOME_PLATELET_ACTIVATION_TRIGGERS |
| Enrichment Score (ES) | 0.673029 |
| Normalized Enrichment Score (NES) | 1.5217035 |
| Nominal p-value | 0.043809526 |
| FDR q-value | 0.6355588 |
| FWER p-Value | 1.0 |
| PROBE | DESCRIPTION (from dataset) | GENE SYMBOL | GENE_TITLE | RANK IN GENE LIST | RANK METRIC SCORE | RUNNING ES | CORE ENRICHMENT | |
|---|---|---|---|---|---|---|---|---|
| 1 | PRKCZ | 3780279 | 21 | 3.117 | 0.2282 | Yes | ||
| 2 | GNG2 | 2230390 | 332 | 1.627 | 0.3313 | Yes | ||
| 3 | GNB1 | 2120397 | 426 | 1.508 | 0.4372 | Yes | ||
| 4 | GNA13 | 4590102 | 740 | 1.205 | 0.5091 | Yes | ||
| 5 | PDPK1 | 6650168 | 798 | 1.163 | 0.5916 | Yes | ||
| 6 | PIK3CB | 3800600 | 837 | 1.134 | 0.6730 | Yes | ||
| 7 | MAPK14 | 5290731 | 2468 | 0.418 | 0.6161 | No | ||
| 8 | FYN | 2100468 4760520 4850687 | 2920 | 0.311 | 0.6147 | No | ||
| 9 | GNAQ | 430670 4210131 5900736 | 4671 | 0.110 | 0.5287 | No | ||
| 10 | SYK | 6940133 | 6203 | 0.053 | 0.4503 | No | ||
| 11 | P2RY1 | 6040121 | 7662 | 0.025 | 0.3737 | No | ||
| 12 | F2RL2 | 6110736 | 8350 | 0.014 | 0.3378 | No | ||
| 13 | FCER1G | 5550020 | 8594 | 0.011 | 0.3255 | No | ||
| 14 | AKT1 | 5290746 | 9501 | -0.002 | 0.2769 | No | ||
| 15 | PIK3R1 | 4730671 | 9986 | -0.008 | 0.2515 | No | ||
| 16 | PLA2G4A | 6380364 | 10846 | -0.021 | 0.2069 | No | ||
| 17 | LCP2 | 2680066 6650707 | 10878 | -0.022 | 0.2068 | No | ||
| 18 | LYN | 6040600 | 12550 | -0.056 | 0.1211 | No | ||
| 19 | F2 | 5720280 | 14186 | -0.127 | 0.0425 | No | ||
| 20 | F2R | 4810180 | 14545 | -0.155 | 0.0347 | No | ||
| 21 | TBXA2R | 2370292 3940066 | 15600 | -0.286 | -0.0009 | No | ||
| 22 | PIK3CG | 5890110 | 16793 | -0.589 | -0.0217 | No | ||
| 23 | VAV1 | 6020487 | 17150 | -0.727 | 0.0127 | No | ||
| 24 | PLCG2 | 5720008 | 17515 | -0.899 | 0.0592 | No |

