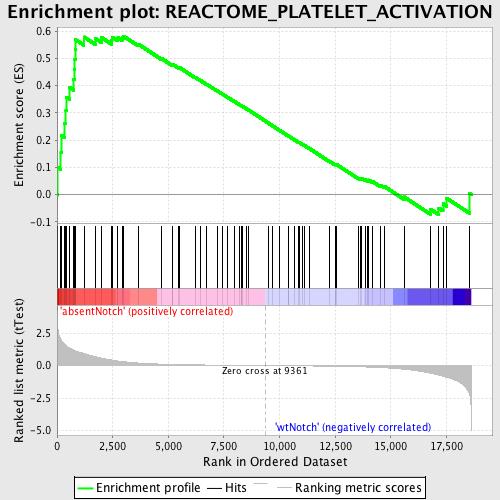
Profile of the Running ES Score & Positions of GeneSet Members on the Rank Ordered List
| Dataset | Set_03_absentNotch_versus_wtNotch.phenotype_absentNotch_versus_wtNotch.cls #absentNotch_versus_wtNotch.phenotype_absentNotch_versus_wtNotch.cls #absentNotch_versus_wtNotch_repos |
| Phenotype | phenotype_absentNotch_versus_wtNotch.cls#absentNotch_versus_wtNotch_repos |
| Upregulated in class | absentNotch |
| GeneSet | REACTOME_PLATELET_ACTIVATION |
| Enrichment Score (ES) | 0.5813045 |
| Normalized Enrichment Score (NES) | 1.5708041 |
| Nominal p-value | 0.003552398 |
| FDR q-value | 0.86760163 |
| FWER p-Value | 0.975 |
| PROBE | DESCRIPTION (from dataset) | GENE SYMBOL | GENE_TITLE | RANK IN GENE LIST | RANK METRIC SCORE | RUNNING ES | CORE ENRICHMENT | |
|---|---|---|---|---|---|---|---|---|
| 1 | PRKCZ | 3780279 | 21 | 3.117 | 0.1001 | Yes | ||
| 2 | CD63 | 6660451 | 173 | 1.986 | 0.1564 | Yes | ||
| 3 | CD9 | 4730041 | 208 | 1.912 | 0.2166 | Yes | ||
| 4 | GNG2 | 2230390 | 332 | 1.627 | 0.2628 | Yes | ||
| 5 | PF4 | 6130332 | 396 | 1.542 | 0.3095 | Yes | ||
| 6 | GNB1 | 2120397 | 426 | 1.508 | 0.3569 | Yes | ||
| 7 | ACTN4 | 3840301 4590390 7050132 | 572 | 1.337 | 0.3925 | Yes | ||
| 8 | GNA13 | 4590102 | 740 | 1.205 | 0.4226 | Yes | ||
| 9 | APP | 2510053 | 778 | 1.180 | 0.4589 | Yes | ||
| 10 | PDPK1 | 6650168 | 798 | 1.163 | 0.4957 | Yes | ||
| 11 | CLU | 5420075 | 820 | 1.148 | 0.5318 | Yes | ||
| 12 | PIK3CB | 3800600 | 837 | 1.134 | 0.5678 | Yes | ||
| 13 | LAMP2 | 1230402 1980373 | 1208 | 0.932 | 0.5781 | Yes | ||
| 14 | IGF1 | 1990193 3130377 3290280 | 1730 | 0.674 | 0.5719 | Yes | ||
| 15 | STX4 | 6270632 | 2007 | 0.564 | 0.5753 | Yes | ||
| 16 | SERPING1 | 5550440 | 2446 | 0.424 | 0.5655 | Yes | ||
| 17 | MAPK14 | 5290731 | 2468 | 0.418 | 0.5779 | Yes | ||
| 18 | TIMP1 | 1010326 | 2734 | 0.351 | 0.5750 | Yes | ||
| 19 | FYN | 2100468 4760520 4850687 | 2920 | 0.311 | 0.5751 | Yes | ||
| 20 | P2RX1 | 2940021 3290338 | 2985 | 0.296 | 0.5813 | Yes | ||
| 21 | FGA | 4210056 5220239 | 3653 | 0.193 | 0.5516 | No | ||
| 22 | GNAQ | 430670 4210131 5900736 | 4671 | 0.110 | 0.5004 | No | ||
| 23 | PROS1 | 5420465 | 5164 | 0.086 | 0.4766 | No | ||
| 24 | MMRN1 | 7050278 | 5179 | 0.086 | 0.4787 | No | ||
| 25 | STXBP3 | 780706 | 5468 | 0.075 | 0.4656 | No | ||
| 26 | F5 | 1990619 | 5499 | 0.074 | 0.4664 | No | ||
| 27 | SYK | 6940133 | 6203 | 0.053 | 0.4302 | No | ||
| 28 | TMSB4X | 6620114 | 6439 | 0.048 | 0.4191 | No | ||
| 29 | GP1BB | 3780075 | 6721 | 0.041 | 0.4053 | No | ||
| 30 | PPBP | 5130446 | 7202 | 0.032 | 0.3804 | No | ||
| 31 | CFD | 2320736 | 7455 | 0.028 | 0.3678 | No | ||
| 32 | P2RY1 | 6040121 | 7662 | 0.025 | 0.3575 | No | ||
| 33 | PLG | 3360270 3840100 | 7965 | 0.020 | 0.3418 | No | ||
| 34 | GP9 | 1190181 | 8185 | 0.017 | 0.3306 | No | ||
| 35 | LEFTY2 | 5670364 | 8270 | 0.015 | 0.3265 | No | ||
| 36 | F8 | 2190647 2340465 | 8286 | 0.015 | 0.3262 | No | ||
| 37 | F2RL2 | 6110736 | 8350 | 0.014 | 0.3233 | No | ||
| 38 | KNG1 | 6400576 6770347 | 8500 | 0.012 | 0.3156 | No | ||
| 39 | FCER1G | 5550020 | 8594 | 0.011 | 0.3110 | No | ||
| 40 | AKT1 | 5290746 | 9501 | -0.002 | 0.2622 | No | ||
| 41 | ITGA2B | 2680538 | 9689 | -0.004 | 0.2522 | No | ||
| 42 | PIK3R1 | 4730671 | 9986 | -0.008 | 0.2366 | No | ||
| 43 | CD36 | 5890575 | 10378 | -0.014 | 0.2159 | No | ||
| 44 | HRG | 2340161 | 10389 | -0.015 | 0.2159 | No | ||
| 45 | GP1BA | 6590372 | 10659 | -0.019 | 0.2020 | No | ||
| 46 | PLA2G4A | 6380364 | 10846 | -0.021 | 0.1927 | No | ||
| 47 | LCP2 | 2680066 6650707 | 10878 | -0.022 | 0.1917 | No | ||
| 48 | SERPINE1 | 4210403 | 11026 | -0.025 | 0.1846 | No | ||
| 49 | FGB | 7000010 | 11128 | -0.026 | 0.1800 | No | ||
| 50 | SPARC | 1690086 | 11350 | -0.030 | 0.1690 | No | ||
| 51 | A2M | 6620039 | 12256 | -0.049 | 0.1218 | No | ||
| 52 | HGF | 3360593 | 12498 | -0.055 | 0.1106 | No | ||
| 53 | ITGB3 | 5270463 | 12530 | -0.056 | 0.1107 | No | ||
| 54 | LYN | 6040600 | 12550 | -0.056 | 0.1115 | No | ||
| 55 | VWF | 4670519 | 13552 | -0.092 | 0.0606 | No | ||
| 56 | EGF | 5220154 | 13636 | -0.096 | 0.0592 | No | ||
| 57 | FN1 | 1170601 2970647 6220288 6940037 | 13693 | -0.099 | 0.0594 | No | ||
| 58 | FGG | 4610717 | 13839 | -0.107 | 0.0551 | No | ||
| 59 | THBS1 | 4560494 430288 | 13959 | -0.114 | 0.0523 | No | ||
| 60 | GP5 | 2510088 | 14000 | -0.116 | 0.0539 | No | ||
| 61 | F2 | 5720280 | 14186 | -0.127 | 0.0481 | No | ||
| 62 | F2R | 4810180 | 14545 | -0.155 | 0.0338 | No | ||
| 63 | SERPINF2 | 2470390 2690292 | 14711 | -0.169 | 0.0304 | No | ||
| 64 | TBXA2R | 2370292 3940066 | 15600 | -0.286 | -0.0081 | No | ||
| 65 | PIK3CG | 5890110 | 16793 | -0.589 | -0.0533 | No | ||
| 66 | VAV1 | 6020487 | 17150 | -0.727 | -0.0489 | No | ||
| 67 | SELP | 6040193 | 17347 | -0.808 | -0.0332 | No | ||
| 68 | PLCG2 | 5720008 | 17515 | -0.899 | -0.0130 | No | ||
| 69 | ALDOA | 6290672 | 18544 | -2.228 | 0.0039 | No |

