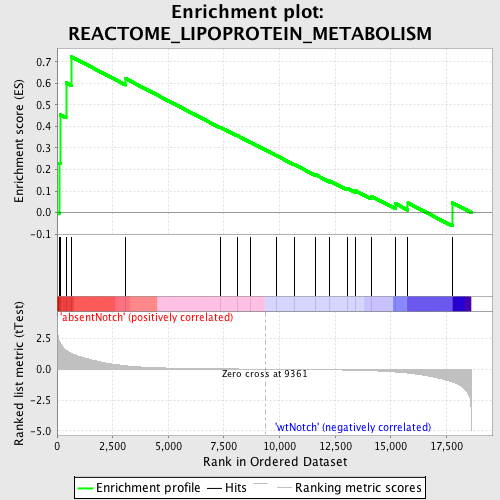
Profile of the Running ES Score & Positions of GeneSet Members on the Rank Ordered List
| Dataset | Set_03_absentNotch_versus_wtNotch.phenotype_absentNotch_versus_wtNotch.cls #absentNotch_versus_wtNotch.phenotype_absentNotch_versus_wtNotch.cls #absentNotch_versus_wtNotch_repos |
| Phenotype | phenotype_absentNotch_versus_wtNotch.cls#absentNotch_versus_wtNotch_repos |
| Upregulated in class | absentNotch |
| GeneSet | REACTOME_LIPOPROTEIN_METABOLISM |
| Enrichment Score (ES) | 0.7232972 |
| Normalized Enrichment Score (NES) | 1.5085483 |
| Nominal p-value | 0.01443299 |
| FDR q-value | 0.6935648 |
| FWER p-Value | 1.0 |
| PROBE | DESCRIPTION (from dataset) | GENE SYMBOL | GENE_TITLE | RANK IN GENE LIST | RANK METRIC SCORE | RUNNING ES | CORE ENRICHMENT | |
|---|---|---|---|---|---|---|---|---|
| 1 | APOE | 4200671 | 109 | 2.229 | 0.2299 | Yes | ||
| 2 | HSPG2 | 2510687 6220750 | 136 | 2.137 | 0.4545 | Yes | ||
| 3 | P4HB | 6110056 | 401 | 1.537 | 0.6029 | Yes | ||
| 4 | MTTP | 3780161 | 652 | 1.266 | 0.7233 | Yes | ||
| 5 | APOA1 | 110152 | 3085 | 0.278 | 0.6219 | No | ||
| 6 | LCAT | 6400441 | 7329 | 0.030 | 0.3969 | No | ||
| 7 | ABCA1 | 6290156 | 8095 | 0.018 | 0.3577 | No | ||
| 8 | CUBN | 630338 | 8677 | 0.010 | 0.3275 | No | ||
| 9 | APOA5 | 6130471 | 9864 | -0.007 | 0.2644 | No | ||
| 10 | APOA2 | 6510364 6860411 | 10648 | -0.018 | 0.2243 | No | ||
| 11 | APOC3 | 2030168 | 11617 | -0.035 | 0.1760 | No | ||
| 12 | A2M | 6620039 | 12256 | -0.049 | 0.1468 | No | ||
| 13 | APOA4 | 4120451 | 13033 | -0.072 | 0.1126 | No | ||
| 14 | LIPC | 2690497 | 13429 | -0.087 | 0.1006 | No | ||
| 15 | APOB | 2370672 | 14114 | -0.123 | 0.0768 | No | ||
| 16 | LDLR | 5670386 | 15211 | -0.224 | 0.0415 | No | ||
| 17 | APOC2 | 50100 | 15771 | -0.315 | 0.0447 | No | ||
| 18 | LPL | 1450735 2970706 | 17760 | -1.023 | 0.0460 | No |

