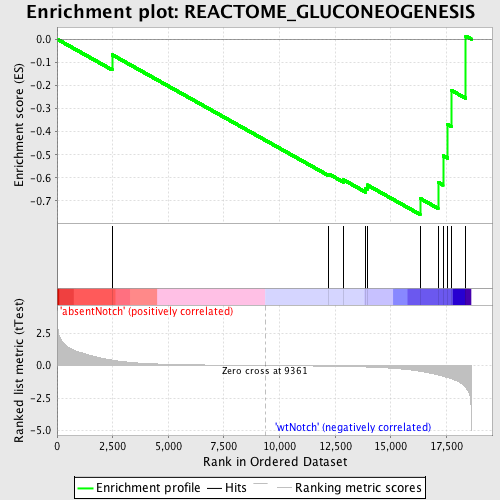
Profile of the Running ES Score & Positions of GeneSet Members on the Rank Ordered List
| Dataset | Set_03_absentNotch_versus_wtNotch.phenotype_absentNotch_versus_wtNotch.cls #absentNotch_versus_wtNotch.phenotype_absentNotch_versus_wtNotch.cls #absentNotch_versus_wtNotch_repos |
| Phenotype | phenotype_absentNotch_versus_wtNotch.cls#absentNotch_versus_wtNotch_repos |
| Upregulated in class | wtNotch |
| GeneSet | REACTOME_GLUCONEOGENESIS |
| Enrichment Score (ES) | -0.75839657 |
| Normalized Enrichment Score (NES) | -1.4345922 |
| Nominal p-value | 0.06889353 |
| FDR q-value | 0.56362474 |
| FWER p-Value | 1.0 |
| PROBE | DESCRIPTION (from dataset) | GENE SYMBOL | GENE_TITLE | RANK IN GENE LIST | RANK METRIC SCORE | RUNNING ES | CORE ENRICHMENT | |
|---|---|---|---|---|---|---|---|---|
| 1 | G6PC | 430093 | 2475 | 0.416 | -0.0674 | No | ||
| 2 | MDH2 | 1850601 | 12214 | -0.047 | -0.5833 | No | ||
| 3 | MDH1 | 6660358 6760731 | 12869 | -0.065 | -0.6082 | No | ||
| 4 | FBP2 | 1580193 | 13867 | -0.109 | -0.6447 | No | ||
| 5 | PCK1 | 7000358 | 13939 | -0.113 | -0.6307 | No | ||
| 6 | SLC25A1 | 4050402 | 16316 | -0.442 | -0.6888 | Yes | ||
| 7 | SLC25A11 | 130097 770685 | 17124 | -0.717 | -0.6192 | Yes | ||
| 8 | GOT1 | 2940465 | 17346 | -0.808 | -0.5039 | Yes | ||
| 9 | TPI1 | 1500215 2100154 | 17555 | -0.922 | -0.3699 | Yes | ||
| 10 | PGK1 | 1570494 630300 | 17714 | -1.000 | -0.2209 | Yes | ||
| 11 | GOT2 | 4570164 5220450 | 18372 | -1.711 | 0.0131 | Yes |

