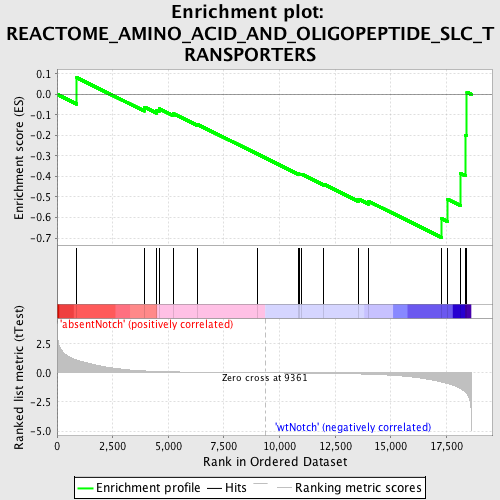
Profile of the Running ES Score & Positions of GeneSet Members on the Rank Ordered List
| Dataset | Set_03_absentNotch_versus_wtNotch.phenotype_absentNotch_versus_wtNotch.cls #absentNotch_versus_wtNotch.phenotype_absentNotch_versus_wtNotch.cls #absentNotch_versus_wtNotch_repos |
| Phenotype | phenotype_absentNotch_versus_wtNotch.cls#absentNotch_versus_wtNotch_repos |
| Upregulated in class | wtNotch |
| GeneSet | REACTOME_AMINO_ACID_AND_OLIGOPEPTIDE_SLC_TRANSPORTERS |
| Enrichment Score (ES) | -0.6973301 |
| Normalized Enrichment Score (NES) | -1.5220182 |
| Nominal p-value | 0.030864198 |
| FDR q-value | 0.37309343 |
| FWER p-Value | 1.0 |

| PROBE | DESCRIPTION (from dataset) | GENE SYMBOL | GENE_TITLE | RANK IN GENE LIST | RANK METRIC SCORE | RUNNING ES | CORE ENRICHMENT | |
|---|---|---|---|---|---|---|---|---|
| 1 | SLC6A6 | 6100300 | 884 | 1.094 | 0.0816 | No | ||
| 2 | SLC1A1 | 520372 6420059 | 3915 | 0.165 | -0.0618 | No | ||
| 3 | SLC7A1 | 2450193 2710241 | 4469 | 0.122 | -0.0772 | No | ||
| 4 | SLC6A12 | 3170685 | 4584 | 0.116 | -0.0696 | No | ||
| 5 | SLC1A5 | 670133 3140020 | 5217 | 0.084 | -0.0937 | No | ||
| 6 | SLC36A2 | 1170288 | 6328 | 0.050 | -0.1474 | No | ||
| 7 | SLC7A9 | 5420735 5700450 | 8990 | 0.005 | -0.2899 | No | ||
| 8 | SLC17A1 | 5420070 | 10841 | -0.021 | -0.3868 | No | ||
| 9 | SLC6A19 | 10575 7040372 | 10916 | -0.023 | -0.3881 | No | ||
| 10 | SLC5A8 | 4070139 6130110 | 10989 | -0.024 | -0.3892 | No | ||
| 11 | SLC17A8 | 2630397 | 11978 | -0.042 | -0.4373 | No | ||
| 12 | SLC3A1 | 3830609 | 13553 | -0.092 | -0.5110 | No | ||
| 13 | SLC36A1 | 5080242 | 13996 | -0.116 | -0.5211 | No | ||
| 14 | SLC15A2 | 1780538 | 17274 | -0.778 | -0.6055 | Yes | ||
| 15 | SLC7A5 | 3310746 | 17560 | -0.924 | -0.5118 | Yes | ||
| 16 | SLC1A4 | 5290064 | 18134 | -1.336 | -0.3849 | Yes | ||
| 17 | SLC15A4 | 5900082 | 18355 | -1.676 | -0.1990 | Yes | ||
| 18 | SLC3A2 | 5270358 | 18421 | -1.804 | 0.0105 | Yes |

