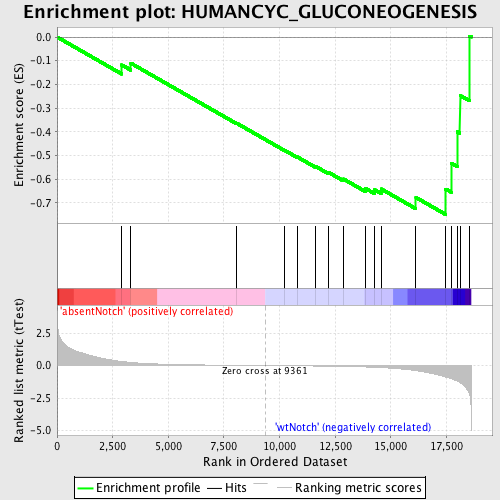
Profile of the Running ES Score & Positions of GeneSet Members on the Rank Ordered List
| Dataset | Set_03_absentNotch_versus_wtNotch.phenotype_absentNotch_versus_wtNotch.cls #absentNotch_versus_wtNotch.phenotype_absentNotch_versus_wtNotch.cls #absentNotch_versus_wtNotch_repos |
| Phenotype | phenotype_absentNotch_versus_wtNotch.cls#absentNotch_versus_wtNotch_repos |
| Upregulated in class | wtNotch |
| GeneSet | HUMANCYC_GLUCONEOGENESIS |
| Enrichment Score (ES) | -0.7494066 |
| Normalized Enrichment Score (NES) | -1.5912095 |
| Nominal p-value | 0.010309278 |
| FDR q-value | 0.20012596 |
| FWER p-Value | 0.967 |
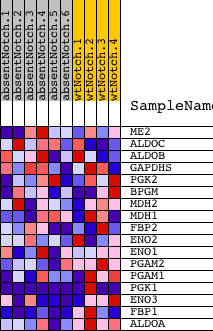
| PROBE | DESCRIPTION (from dataset) | GENE SYMBOL | GENE_TITLE | RANK IN GENE LIST | RANK METRIC SCORE | RUNNING ES | CORE ENRICHMENT | |
|---|---|---|---|---|---|---|---|---|
| 1 | ME2 | 5080121 | 2908 | 0.313 | -0.1179 | No | ||
| 2 | ALDOC | 450121 610427 | 3315 | 0.238 | -0.1105 | No | ||
| 3 | ALDOB | 4730324 | 8081 | 0.018 | -0.3645 | No | ||
| 4 | GAPDHS | 2690463 | 10205 | -0.012 | -0.4772 | No | ||
| 5 | PGK2 | 2650091 | 10793 | -0.021 | -0.5062 | No | ||
| 6 | BPGM | 5080520 | 11612 | -0.035 | -0.5459 | No | ||
| 7 | MDH2 | 1850601 | 12214 | -0.047 | -0.5724 | No | ||
| 8 | MDH1 | 6660358 6760731 | 12869 | -0.065 | -0.5995 | No | ||
| 9 | FBP2 | 1580193 | 13867 | -0.109 | -0.6397 | No | ||
| 10 | ENO2 | 2320068 | 14279 | -0.133 | -0.6454 | No | ||
| 11 | ENO1 | 5340128 | 14569 | -0.157 | -0.6416 | No | ||
| 12 | PGAM2 | 3610605 | 16128 | -0.389 | -0.6775 | Yes | ||
| 13 | PGAM1 | 2570133 | 17466 | -0.875 | -0.6419 | Yes | ||
| 14 | PGK1 | 1570494 630300 | 17714 | -1.000 | -0.5322 | Yes | ||
| 15 | ENO3 | 5270136 | 17984 | -1.190 | -0.4005 | Yes | ||
| 16 | FBP1 | 1470762 | 18109 | -1.307 | -0.2466 | Yes | ||
| 17 | ALDOA | 6290672 | 18544 | -2.228 | 0.0039 | Yes |