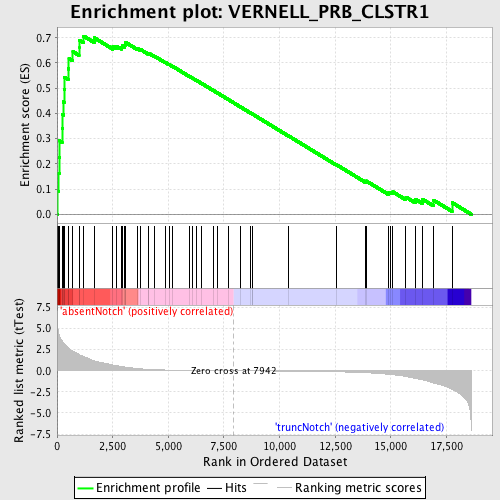
Profile of the Running ES Score & Positions of GeneSet Members on the Rank Ordered List
| Dataset | Set_03_absentNotch_versus_truncNotch.phenotype_absentNotch_versus_truncNotch.cls #absentNotch_versus_truncNotch.phenotype_absentNotch_versus_truncNotch.cls #absentNotch_versus_truncNotch_repos |
| Phenotype | phenotype_absentNotch_versus_truncNotch.cls#absentNotch_versus_truncNotch_repos |
| Upregulated in class | absentNotch |
| GeneSet | VERNELL_PRB_CLSTR1 |
| Enrichment Score (ES) | 0.7063956 |
| Normalized Enrichment Score (NES) | 1.7944396 |
| Nominal p-value | 0.0 |
| FDR q-value | 0.011813895 |
| FWER p-Value | 0.111 |
| PROBE | DESCRIPTION (from dataset) | GENE SYMBOL | GENE_TITLE | RANK IN GENE LIST | RANK METRIC SCORE | RUNNING ES | CORE ENRICHMENT | |
|---|---|---|---|---|---|---|---|---|
| 1 | CDCA4 | 5890315 6110487 | 11 | 5.874 | 0.0933 | Yes | ||
| 2 | TMPO | 4050494 | 74 | 4.448 | 0.1610 | Yes | ||
| 3 | RAD51AP1 | 4050736 6370528 | 93 | 4.193 | 0.2270 | Yes | ||
| 4 | EED | 2320373 | 110 | 4.095 | 0.2916 | Yes | ||
| 5 | MCM4 | 2760673 5420711 | 225 | 3.505 | 0.3415 | Yes | ||
| 6 | SKP2 | 360711 380093 4810368 | 246 | 3.435 | 0.3953 | Yes | ||
| 7 | DCK | 6900411 | 283 | 3.283 | 0.4458 | Yes | ||
| 8 | RFC4 | 3800082 6840142 | 318 | 3.159 | 0.4945 | Yes | ||
| 9 | PCNA | 940754 | 337 | 3.090 | 0.5429 | Yes | ||
| 10 | POLD3 | 6400278 | 499 | 2.715 | 0.5776 | Yes | ||
| 11 | FANCL | 2060520 5220066 5270164 | 533 | 2.626 | 0.6178 | Yes | ||
| 12 | RRM1 | 4150433 | 712 | 2.297 | 0.6449 | Yes | ||
| 13 | TFDP1 | 1980112 | 986 | 1.906 | 0.6606 | Yes | ||
| 14 | RFC3 | 1980600 | 992 | 1.896 | 0.6907 | Yes | ||
| 15 | CDC25A | 3800184 | 1196 | 1.670 | 0.7064 | Yes | ||
| 16 | CCNE1 | 110064 | 1670 | 1.172 | 0.6996 | No | ||
| 17 | RECQL4 | 540551 | 2509 | 0.670 | 0.6652 | No | ||
| 18 | MCM7 | 3290292 5220056 | 2662 | 0.607 | 0.6667 | No | ||
| 19 | EZH2 | 6130605 6380524 | 2881 | 0.506 | 0.6631 | No | ||
| 20 | E2F2 | 5270609 5570377 7000465 | 2918 | 0.493 | 0.6690 | No | ||
| 21 | CNOT6L | 4590333 | 3040 | 0.447 | 0.6696 | No | ||
| 22 | DONSON | 4780541 6130010 | 3059 | 0.438 | 0.6756 | No | ||
| 23 | MELK | 130022 5220537 | 3082 | 0.430 | 0.6813 | No | ||
| 24 | BARD1 | 3170348 | 3612 | 0.261 | 0.6570 | No | ||
| 25 | CDKN1A | 4050088 6400706 | 3730 | 0.231 | 0.6544 | No | ||
| 26 | CHAF1A | 6040647 | 4094 | 0.162 | 0.6374 | No | ||
| 27 | FST | 1110600 | 4120 | 0.158 | 0.6386 | No | ||
| 28 | SNTB2 | 2630014 5390035 | 4366 | 0.127 | 0.6274 | No | ||
| 29 | HMGB2 | 2640603 | 4856 | 0.085 | 0.6025 | No | ||
| 30 | BLM | 520619 5570170 | 5035 | 0.075 | 0.5941 | No | ||
| 31 | RAB27A | 450019 | 5198 | 0.067 | 0.5864 | No | ||
| 32 | HUNK | 7100139 | 5949 | 0.041 | 0.5467 | No | ||
| 33 | JPH1 | 610739 | 6081 | 0.037 | 0.5402 | No | ||
| 34 | FANCA | 6130070 | 6270 | 0.032 | 0.5306 | No | ||
| 35 | ESCO2 | 1170010 | 6508 | 0.027 | 0.5182 | No | ||
| 36 | SLBP | 6220601 | 7013 | 0.016 | 0.4914 | No | ||
| 37 | BTG3 | 7050079 | 7193 | 0.013 | 0.4819 | No | ||
| 38 | CCDC5 | 2480040 | 7710 | 0.004 | 0.4542 | No | ||
| 39 | FBXO5 | 2630551 | 8235 | -0.005 | 0.4260 | No | ||
| 40 | NPAT | 3800594 4670026 | 8689 | -0.012 | 0.4018 | No | ||
| 41 | EPS8 | 7050204 | 8779 | -0.014 | 0.3973 | No | ||
| 42 | PTX3 | 870309 3520102 | 8794 | -0.014 | 0.3967 | No | ||
| 43 | KCNK1 | 1050068 | 10394 | -0.045 | 0.3113 | No | ||
| 44 | MCM8 | 6130743 | 12548 | -0.120 | 0.1972 | No | ||
| 45 | PBX3 | 1300424 3710577 6180575 | 13878 | -0.236 | 0.1294 | No | ||
| 46 | VRK1 | 5890603 6900347 | 13897 | -0.239 | 0.1323 | No | ||
| 47 | CDCA5 | 5670131 | 14899 | -0.414 | 0.0850 | No | ||
| 48 | CENPK | 1740722 6200068 | 14974 | -0.431 | 0.0879 | No | ||
| 49 | ATAD2 | 870242 2260687 | 15095 | -0.464 | 0.0888 | No | ||
| 50 | ANKRD25 | 4850102 | 15679 | -0.677 | 0.0682 | No | ||
| 51 | DEK | 1050451 4560037 | 16111 | -0.906 | 0.0595 | No | ||
| 52 | RRM2 | 6350059 6940162 | 16418 | -1.075 | 0.0602 | No | ||
| 53 | ASF1B | 6590706 | 16915 | -1.450 | 0.0566 | No | ||
| 54 | EGR1 | 4610347 | 17755 | -2.187 | 0.0464 | No |

