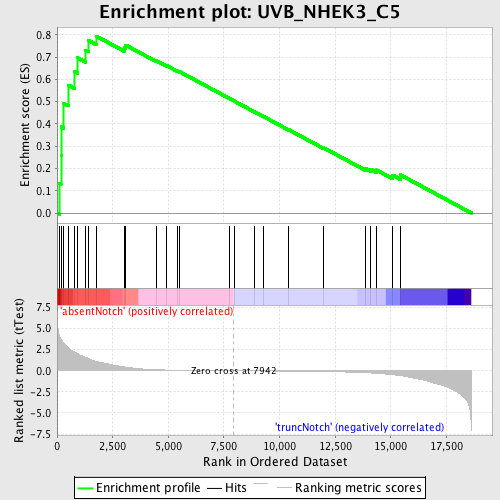
Profile of the Running ES Score & Positions of GeneSet Members on the Rank Ordered List
| Dataset | Set_03_absentNotch_versus_truncNotch.phenotype_absentNotch_versus_truncNotch.cls #absentNotch_versus_truncNotch.phenotype_absentNotch_versus_truncNotch.cls #absentNotch_versus_truncNotch_repos |
| Phenotype | phenotype_absentNotch_versus_truncNotch.cls#absentNotch_versus_truncNotch_repos |
| Upregulated in class | absentNotch |
| GeneSet | UVB_NHEK3_C5 |
| Enrichment Score (ES) | 0.79439527 |
| Normalized Enrichment Score (NES) | 1.8057843 |
| Nominal p-value | 0.0 |
| FDR q-value | 0.010636919 |
| FWER p-Value | 0.085 |
| PROBE | DESCRIPTION (from dataset) | GENE SYMBOL | GENE_TITLE | RANK IN GENE LIST | RANK METRIC SCORE | RUNNING ES | CORE ENRICHMENT | |
|---|---|---|---|---|---|---|---|---|
| 1 | METAP1 | 3520632 | 121 | 4.035 | 0.1331 | Yes | ||
| 2 | CBFB | 1850551 2650035 | 176 | 3.732 | 0.2594 | Yes | ||
| 3 | TLK1 | 7100605 | 183 | 3.696 | 0.3870 | Yes | ||
| 4 | GTF3C2 | 670494 | 302 | 3.221 | 0.4921 | Yes | ||
| 5 | GSK3B | 5360348 | 510 | 2.696 | 0.5743 | Yes | ||
| 6 | RASA1 | 1240315 | 794 | 2.176 | 0.6344 | Yes | ||
| 7 | PPP4R1 | 5670088 6420402 | 928 | 2.007 | 0.6967 | Yes | ||
| 8 | IQGAP1 | 6660494 | 1286 | 1.572 | 0.7319 | Yes | ||
| 9 | TIAM1 | 5420288 | 1420 | 1.424 | 0.7741 | Yes | ||
| 10 | VGLL4 | 6860463 | 1755 | 1.106 | 0.7944 | Yes | ||
| 11 | ZNF148 | 6420403 | 3012 | 0.459 | 0.7427 | No | ||
| 12 | NFE2L2 | 2810619 3390162 | 3075 | 0.432 | 0.7543 | No | ||
| 13 | ABLIM1 | 580170 3710338 6520504 | 4460 | 0.117 | 0.6840 | No | ||
| 14 | RCOR1 | 5360717 | 4910 | 0.082 | 0.6626 | No | ||
| 15 | MME | 6040673 | 5408 | 0.058 | 0.6379 | No | ||
| 16 | ABCC1 | 4760722 6770280 | 5517 | 0.054 | 0.6340 | No | ||
| 17 | EPS15 | 4200215 | 7770 | 0.003 | 0.5130 | No | ||
| 18 | SHB | 4920494 | 7988 | -0.001 | 0.5013 | No | ||
| 19 | JAG1 | 3440390 | 8849 | -0.015 | 0.4556 | No | ||
| 20 | YES1 | 6100050 | 9273 | -0.022 | 0.4336 | No | ||
| 21 | PIK3R4 | 1990132 | 10415 | -0.045 | 0.3738 | No | ||
| 22 | HMGA2 | 2940121 3390647 5130279 6400136 | 11973 | -0.091 | 0.2932 | No | ||
| 23 | PBX3 | 1300424 3710577 6180575 | 13878 | -0.236 | 0.1989 | No | ||
| 24 | ITGB4 | 1740021 3840482 | 14098 | -0.265 | 0.1964 | No | ||
| 25 | EXT1 | 4540603 | 14352 | -0.307 | 0.1934 | No | ||
| 26 | STAT1 | 6510204 6590553 | 15078 | -0.460 | 0.1703 | No | ||
| 27 | PKN2 | 940746 2350168 | 15423 | -0.577 | 0.1718 | No |

