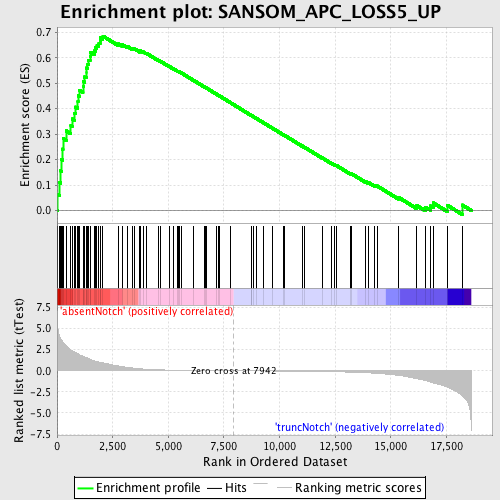
Profile of the Running ES Score & Positions of GeneSet Members on the Rank Ordered List
| Dataset | Set_03_absentNotch_versus_truncNotch.phenotype_absentNotch_versus_truncNotch.cls #absentNotch_versus_truncNotch.phenotype_absentNotch_versus_truncNotch.cls #absentNotch_versus_truncNotch_repos |
| Phenotype | phenotype_absentNotch_versus_truncNotch.cls#absentNotch_versus_truncNotch_repos |
| Upregulated in class | absentNotch |
| GeneSet | SANSOM_APC_LOSS5_UP |
| Enrichment Score (ES) | 0.68488514 |
| Normalized Enrichment Score (NES) | 1.8707211 |
| Nominal p-value | 0.0 |
| FDR q-value | 0.006169725 |
| FWER p-Value | 0.019 |
| PROBE | DESCRIPTION (from dataset) | GENE SYMBOL | GENE_TITLE | RANK IN GENE LIST | RANK METRIC SCORE | RUNNING ES | CORE ENRICHMENT | |
|---|---|---|---|---|---|---|---|---|
| 1 | 2810037C14RIK | 5290575 | 29 | 5.066 | 0.0631 | Yes | ||
| 2 | CDCA7 | 3060097 | 118 | 4.044 | 0.1099 | Yes | ||
| 3 | FTSJ3 | 3140100 | 163 | 3.783 | 0.1558 | Yes | ||
| 4 | GNL3 | 4050338 4810500 | 198 | 3.608 | 0.2000 | Yes | ||
| 5 | PRKRIR | 2370402 | 242 | 3.448 | 0.2417 | Yes | ||
| 6 | HNRPAB | 540504 | 266 | 3.358 | 0.2833 | Yes | ||
| 7 | DDX21 | 6100446 | 409 | 2.918 | 0.3128 | Yes | ||
| 8 | ETF1 | 6770075 | 620 | 2.447 | 0.3327 | Yes | ||
| 9 | NSUN2 | 2120193 | 676 | 2.354 | 0.3598 | Yes | ||
| 10 | HK2 | 2640722 | 770 | 2.214 | 0.3830 | Yes | ||
| 11 | EIF1 | 5080100 | 836 | 2.124 | 0.4066 | Yes | ||
| 12 | SOX4 | 2260091 | 935 | 1.992 | 0.4267 | Yes | ||
| 13 | NOL5 | 580731 | 945 | 1.978 | 0.4515 | Yes | ||
| 14 | CIRH1A | 2340372 | 995 | 1.892 | 0.4729 | Yes | ||
| 15 | FEM1B | 1230110 | 1164 | 1.704 | 0.4856 | Yes | ||
| 16 | UTP14A | 6590048 | 1174 | 1.694 | 0.5067 | Yes | ||
| 17 | COPS2 | 3060142 | 1232 | 1.637 | 0.5246 | Yes | ||
| 18 | 4930573I19RIK | 5270402 | 1308 | 1.544 | 0.5402 | Yes | ||
| 19 | NCL | 2360463 4540279 | 1310 | 1.541 | 0.5598 | Yes | ||
| 20 | EIF4G2 | 3800575 6860184 | 1379 | 1.470 | 0.5749 | Yes | ||
| 21 | TIAM1 | 5420288 | 1420 | 1.424 | 0.5909 | Yes | ||
| 22 | GNL2 | 6620022 | 1483 | 1.362 | 0.6049 | Yes | ||
| 23 | PES1 | 2470427 | 1503 | 1.335 | 0.6209 | Yes | ||
| 24 | 1190002H23RIK | 4480128 | 1672 | 1.171 | 0.6268 | Yes | ||
| 25 | ETS2 | 360451 | 1716 | 1.141 | 0.6391 | Yes | ||
| 26 | PRIM2A | 7000692 | 1791 | 1.081 | 0.6489 | Yes | ||
| 27 | SRR | 1190465 3800494 | 1879 | 1.027 | 0.6573 | Yes | ||
| 28 | ZFP90 | 580121 | 1933 | 0.998 | 0.6671 | Yes | ||
| 29 | RNF4 | 580286 1400152 | 1960 | 0.986 | 0.6783 | Yes | ||
| 30 | MAP4K4 | 2360059 | 2060 | 0.933 | 0.6849 | Yes | ||
| 31 | IFIT2 | 4810735 | 2758 | 0.558 | 0.6544 | No | ||
| 32 | CD24 | 1780091 | 2932 | 0.485 | 0.6513 | No | ||
| 33 | FUSIP1 | 520082 5390114 | 3143 | 0.410 | 0.6452 | No | ||
| 34 | MYC | 380541 4670170 | 3372 | 0.337 | 0.6372 | No | ||
| 35 | ZRF1 | 6020181 6510484 | 3489 | 0.297 | 0.6347 | No | ||
| 36 | RIN2 | 2450184 | 3723 | 0.234 | 0.6251 | No | ||
| 37 | ORC2L | 1990470 6510019 | 3731 | 0.231 | 0.6277 | No | ||
| 38 | TXNL4A | 4120286 6510242 | 3870 | 0.204 | 0.6228 | No | ||
| 39 | OLFR91 | 6290020 | 4002 | 0.177 | 0.6180 | No | ||
| 40 | FOXA2 | 540338 5860441 | 4553 | 0.108 | 0.5897 | No | ||
| 41 | LAMC2 | 450692 2680041 4200059 4670148 | 4629 | 0.102 | 0.5870 | No | ||
| 42 | NUP54 | 940546 2360156 4060278 | 5060 | 0.073 | 0.5647 | No | ||
| 43 | SEMA3C | 7000020 | 5225 | 0.066 | 0.5567 | No | ||
| 44 | EPHB3 | 6650341 | 5432 | 0.057 | 0.5463 | No | ||
| 45 | RNF149 | 5270494 | 5435 | 0.057 | 0.5470 | No | ||
| 46 | BTC | 3190133 | 5492 | 0.055 | 0.5446 | No | ||
| 47 | KIF5A | 510435 | 5607 | 0.052 | 0.5391 | No | ||
| 48 | SYNCRIP | 1690195 3140113 4670279 | 6115 | 0.036 | 0.5122 | No | ||
| 49 | PKP1 | 1500433 | 6637 | 0.024 | 0.4844 | No | ||
| 50 | CITED1 | 2350670 | 6682 | 0.023 | 0.4824 | No | ||
| 51 | PTBP2 | 1240398 | 6725 | 0.022 | 0.4804 | No | ||
| 52 | ZFP97 | 520324 | 7155 | 0.014 | 0.4574 | No | ||
| 53 | REPS1 | 2320603 2510333 | 7251 | 0.012 | 0.4524 | No | ||
| 54 | 9630050M13RIK | 2370086 | 7318 | 0.011 | 0.4490 | No | ||
| 55 | PLA2G12A | 1740463 4010066 4050348 | 7793 | 0.002 | 0.4235 | No | ||
| 56 | ADAM8 | 450347 5670609 | 8744 | -0.013 | 0.3724 | No | ||
| 57 | FAM60A | 3940092 | 8756 | -0.014 | 0.3720 | No | ||
| 58 | TSPAN12 | 4120010 | 8819 | -0.015 | 0.3688 | No | ||
| 59 | 1110014J01RIK | 1980332 | 8953 | -0.017 | 0.3618 | No | ||
| 60 | TGFBR1 | 1400148 4280020 6550711 | 9267 | -0.022 | 0.3452 | No | ||
| 61 | HELLS | 4560086 4810025 | 9678 | -0.030 | 0.3235 | No | ||
| 62 | MYO1B | 770372 | 10173 | -0.041 | 0.2974 | No | ||
| 63 | ANP32B | 940095 2450494 4200368 | 10218 | -0.041 | 0.2955 | No | ||
| 64 | FGFR4 | 2650072 | 11007 | -0.059 | 0.2538 | No | ||
| 65 | 2300002G24RIK | 2320040 | 11112 | -0.062 | 0.2489 | No | ||
| 66 | MMP7 | 1780497 | 11916 | -0.089 | 0.2067 | No | ||
| 67 | KIF20A | 2650050 | 12325 | -0.108 | 0.1861 | No | ||
| 68 | CEBPZ | 2970053 2680068 | 12470 | -0.116 | 0.1798 | No | ||
| 69 | PLA2G2A | 3190458 | 12536 | -0.120 | 0.1779 | No | ||
| 70 | HDC | 4150463 | 13208 | -0.166 | 0.1438 | No | ||
| 71 | ZZZ3 | 780133 2320239 2640452 5080706 6550341 | 13217 | -0.167 | 0.1455 | No | ||
| 72 | DDIT4 | 2570408 | 13851 | -0.234 | 0.1143 | No | ||
| 73 | KCND2 | 1170128 2100112 | 13984 | -0.250 | 0.1104 | No | ||
| 74 | CD44 | 3990072 4850671 5860411 6860148 7050551 | 14275 | -0.293 | 0.0985 | No | ||
| 75 | TNFRSF19 | 3870731 6940730 | 14385 | -0.313 | 0.0966 | No | ||
| 76 | MDFI | 6200041 | 15343 | -0.546 | 0.0519 | No | ||
| 77 | KCNQ1 | 1580050 6860441 | 16168 | -0.942 | 0.0195 | No | ||
| 78 | ZBTB17 | 6220082 | 16559 | -1.168 | 0.0133 | No | ||
| 79 | SLC27A1 | 6110093 | 16785 | -1.324 | 0.0181 | No | ||
| 80 | CDK9 | 630707 | 16907 | -1.447 | 0.0300 | No | ||
| 81 | SMYD5 | 6220025 | 17541 | -1.940 | 0.0206 | No | ||
| 82 | GRWD1 | 6350528 | 18211 | -2.926 | 0.0219 | No |

