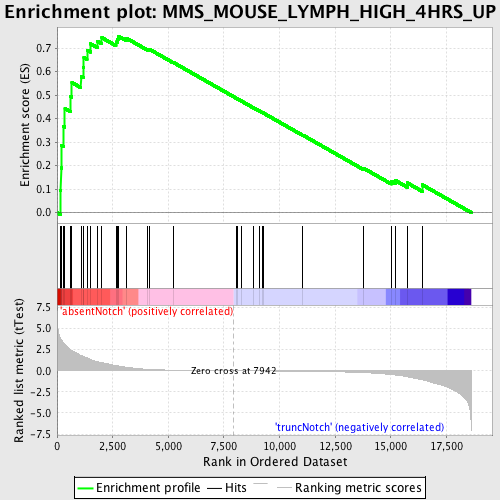
Profile of the Running ES Score & Positions of GeneSet Members on the Rank Ordered List
| Dataset | Set_03_absentNotch_versus_truncNotch.phenotype_absentNotch_versus_truncNotch.cls #absentNotch_versus_truncNotch.phenotype_absentNotch_versus_truncNotch.cls #absentNotch_versus_truncNotch_repos |
| Phenotype | phenotype_absentNotch_versus_truncNotch.cls#absentNotch_versus_truncNotch_repos |
| Upregulated in class | absentNotch |
| GeneSet | MMS_MOUSE_LYMPH_HIGH_4HRS_UP |
| Enrichment Score (ES) | 0.7507117 |
| Normalized Enrichment Score (NES) | 1.8064816 |
| Nominal p-value | 0.0 |
| FDR q-value | 0.01157142 |
| FWER p-Value | 0.084 |
| PROBE | DESCRIPTION (from dataset) | GENE SYMBOL | GENE_TITLE | RANK IN GENE LIST | RANK METRIC SCORE | RUNNING ES | CORE ENRICHMENT | |
|---|---|---|---|---|---|---|---|---|
| 1 | PRKAR1A | 3450369 | 145 | 3.872 | 0.0937 | Yes | ||
| 2 | CXCR4 | 4590519 | 174 | 3.739 | 0.1902 | Yes | ||
| 3 | UBE1C | 6040341 | 190 | 3.659 | 0.2853 | Yes | ||
| 4 | DCK | 6900411 | 283 | 3.283 | 0.3665 | Yes | ||
| 5 | PELI1 | 3870215 6900040 | 353 | 3.055 | 0.4428 | Yes | ||
| 6 | HNRPDL | 1050102 1090181 5360471 | 603 | 2.480 | 0.4944 | Yes | ||
| 7 | ATP6V1A | 6590242 | 666 | 2.364 | 0.5531 | Yes | ||
| 8 | PGRMC1 | 4150692 | 1073 | 1.808 | 0.5786 | Yes | ||
| 9 | VBP1 | 4070050 | 1182 | 1.688 | 0.6171 | Yes | ||
| 10 | CCRN4L | 50438 5130372 | 1205 | 1.663 | 0.6595 | Yes | ||
| 11 | TXNRD1 | 6590446 | 1345 | 1.508 | 0.6915 | Yes | ||
| 12 | RBBP7 | 430113 450450 2370309 | 1507 | 1.334 | 0.7178 | Yes | ||
| 13 | CYB5A | 5080450 | 1812 | 1.069 | 0.7295 | Yes | ||
| 14 | EIF4A2 | 1170494 1740711 2850504 | 2011 | 0.958 | 0.7440 | Yes | ||
| 15 | RBBP6 | 2320129 | 2647 | 0.613 | 0.7259 | Yes | ||
| 16 | CDC6 | 4570296 5360600 | 2713 | 0.578 | 0.7375 | Yes | ||
| 17 | XBP1 | 3840594 | 2744 | 0.564 | 0.7507 | Yes | ||
| 18 | MARK2 | 7210608 | 3106 | 0.424 | 0.7424 | No | ||
| 19 | FEN1 | 1770541 | 4062 | 0.166 | 0.6954 | No | ||
| 20 | VPS4B | 3440332 | 4149 | 0.154 | 0.6948 | No | ||
| 21 | SP3 | 3840338 | 5216 | 0.066 | 0.6391 | No | ||
| 22 | RCN2 | 840324 | 8060 | -0.002 | 0.4862 | No | ||
| 23 | RAB18 | 3120575 4590577 | 8119 | -0.003 | 0.4831 | No | ||
| 24 | PTDSS1 | 6020215 | 8306 | -0.006 | 0.4733 | No | ||
| 25 | LYPLA1 | 4480373 5570551 | 8817 | -0.015 | 0.4462 | No | ||
| 26 | PSMA3 | 5900047 7040161 | 9078 | -0.019 | 0.4327 | No | ||
| 27 | LMO4 | 3800746 | 9219 | -0.021 | 0.4258 | No | ||
| 28 | HMGB3 | 2940168 | 9260 | -0.022 | 0.4242 | No | ||
| 29 | GAS5 | 1980136 4210551 | 11041 | -0.060 | 0.3300 | No | ||
| 30 | NQO1 | 3450136 6840121 | 13769 | -0.226 | 0.1891 | No | ||
| 31 | EIF1AY | 1230541 6130301 | 15021 | -0.443 | 0.1334 | No | ||
| 32 | PLK4 | 430162 5720110 | 15212 | -0.506 | 0.1365 | No | ||
| 33 | ACTG1 | 540215 | 15739 | -0.702 | 0.1266 | No | ||
| 34 | RRM2 | 6350059 6940162 | 16418 | -1.075 | 0.1183 | No |

