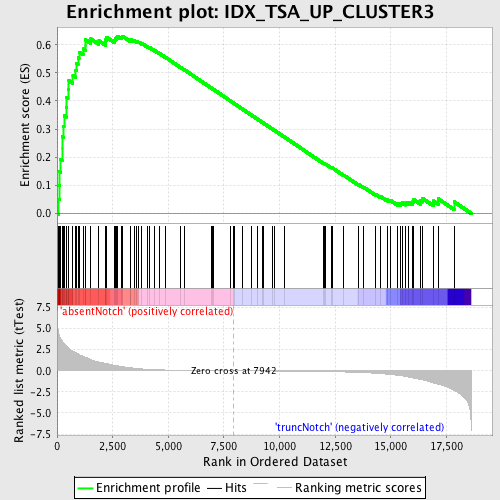
Profile of the Running ES Score & Positions of GeneSet Members on the Rank Ordered List
| Dataset | Set_03_absentNotch_versus_truncNotch.phenotype_absentNotch_versus_truncNotch.cls #absentNotch_versus_truncNotch.phenotype_absentNotch_versus_truncNotch.cls #absentNotch_versus_truncNotch_repos |
| Phenotype | phenotype_absentNotch_versus_truncNotch.cls#absentNotch_versus_truncNotch_repos |
| Upregulated in class | absentNotch |
| GeneSet | IDX_TSA_UP_CLUSTER3 |
| Enrichment Score (ES) | 0.63060486 |
| Normalized Enrichment Score (NES) | 1.7500933 |
| Nominal p-value | 0.0 |
| FDR q-value | 0.028949449 |
| FWER p-Value | 0.293 |
| PROBE | DESCRIPTION (from dataset) | GENE SYMBOL | GENE_TITLE | RANK IN GENE LIST | RANK METRIC SCORE | RUNNING ES | CORE ENRICHMENT | |
|---|---|---|---|---|---|---|---|---|
| 1 | FIGNL1 | 6860390 | 69 | 4.471 | 0.0506 | Yes | ||
| 2 | RAD51AP1 | 4050736 6370528 | 93 | 4.193 | 0.1003 | Yes | ||
| 3 | CDCA7 | 3060097 | 118 | 4.044 | 0.1481 | Yes | ||
| 4 | CDCA8 | 2340286 6980019 | 157 | 3.797 | 0.1922 | Yes | ||
| 5 | NCAPH | 6220435 | 224 | 3.506 | 0.2312 | Yes | ||
| 6 | MCM4 | 2760673 5420711 | 225 | 3.505 | 0.2738 | Yes | ||
| 7 | DCK | 6900411 | 283 | 3.283 | 0.3106 | Yes | ||
| 8 | NASP | 2260139 2940369 5130707 | 312 | 3.185 | 0.3478 | Yes | ||
| 9 | PRC1 | 870092 5890204 | 406 | 2.929 | 0.3784 | Yes | ||
| 10 | MAD2L1 | 4480725 | 417 | 2.886 | 0.4129 | Yes | ||
| 11 | CSTF2 | 6040463 | 491 | 2.727 | 0.4421 | Yes | ||
| 12 | CCNE2 | 3120537 | 529 | 2.639 | 0.4722 | Yes | ||
| 13 | RRM1 | 4150433 | 712 | 2.297 | 0.4903 | Yes | ||
| 14 | CCNB1 | 4590433 4780372 | 841 | 2.121 | 0.5091 | Yes | ||
| 15 | ILF2 | 2900253 | 868 | 2.089 | 0.5331 | Yes | ||
| 16 | MAN2A1 | 6650176 | 942 | 1.980 | 0.5532 | Yes | ||
| 17 | TFDP1 | 1980112 | 986 | 1.906 | 0.5741 | Yes | ||
| 18 | PRIM1 | 6420746 | 1167 | 1.702 | 0.5850 | Yes | ||
| 19 | BZW1 | 460270 | 1269 | 1.584 | 0.5988 | Yes | ||
| 20 | NUSAP1 | 940048 3120435 | 1271 | 1.583 | 0.6180 | Yes | ||
| 21 | KIF4A | 1410465 4760070 | 1519 | 1.317 | 0.6207 | Yes | ||
| 22 | AURKA | 780537 | 1880 | 1.026 | 0.6137 | Yes | ||
| 23 | TRIP13 | 6860341 | 2170 | 0.868 | 0.6087 | Yes | ||
| 24 | TACC3 | 5130592 | 2191 | 0.853 | 0.6180 | Yes | ||
| 25 | RFC5 | 3800452 6020091 | 2218 | 0.838 | 0.6267 | Yes | ||
| 26 | DLG7 | 3120041 | 2590 | 0.639 | 0.6145 | Yes | ||
| 27 | MCM3 | 5570068 | 2610 | 0.627 | 0.6211 | Yes | ||
| 28 | MCM7 | 3290292 5220056 | 2662 | 0.607 | 0.6257 | Yes | ||
| 29 | CDC6 | 4570296 5360600 | 2713 | 0.578 | 0.6300 | Yes | ||
| 30 | EZH2 | 6130605 6380524 | 2881 | 0.506 | 0.6272 | Yes | ||
| 31 | KIF2C | 6940082 | 2928 | 0.487 | 0.6306 | Yes | ||
| 32 | SLCO3A1 | 1050408 2370156 6110072 | 3287 | 0.360 | 0.6157 | No | ||
| 33 | RACGAP1 | 3990162 6620736 | 3299 | 0.354 | 0.6194 | No | ||
| 34 | CDC45L | 70537 3130114 | 3466 | 0.305 | 0.6141 | No | ||
| 35 | OSMR | 1990519 | 3587 | 0.270 | 0.6109 | No | ||
| 36 | SMC2 | 4810133 | 3670 | 0.247 | 0.6095 | No | ||
| 37 | IL13RA1 | 5550609 | 3812 | 0.214 | 0.6045 | No | ||
| 38 | FEN1 | 1770541 | 4062 | 0.166 | 0.5931 | No | ||
| 39 | KLF5 | 3840348 | 4156 | 0.153 | 0.5899 | No | ||
| 40 | INCENP | 520593 | 4390 | 0.124 | 0.5789 | No | ||
| 41 | TOPBP1 | 6020333 | 4595 | 0.105 | 0.5691 | No | ||
| 42 | HMGB2 | 2640603 | 4856 | 0.085 | 0.5561 | No | ||
| 43 | POLA1 | 4760541 | 5556 | 0.053 | 0.5191 | No | ||
| 44 | TTK | 3800129 | 5743 | 0.047 | 0.5096 | No | ||
| 45 | HGF | 3360593 | 6940 | 0.018 | 0.4453 | No | ||
| 46 | CCNB2 | 6510528 | 6991 | 0.017 | 0.4428 | No | ||
| 47 | SLBP | 6220601 | 7013 | 0.016 | 0.4419 | No | ||
| 48 | WNT4 | 4150619 | 7808 | 0.002 | 0.3991 | No | ||
| 49 | KIF11 | 5390139 | 7948 | -0.000 | 0.3916 | No | ||
| 50 | BRCA1 | 4780669 | 7993 | -0.001 | 0.3892 | No | ||
| 51 | CKS2 | 1410156 | 8353 | -0.007 | 0.3699 | No | ||
| 52 | ADAM8 | 450347 5670609 | 8744 | -0.013 | 0.3490 | No | ||
| 53 | ABCA1 | 6290156 | 9025 | -0.018 | 0.3341 | No | ||
| 54 | LMO4 | 3800746 | 9219 | -0.021 | 0.3240 | No | ||
| 55 | MCM10 | 4920632 | 9286 | -0.023 | 0.3207 | No | ||
| 56 | HELLS | 4560086 4810025 | 9678 | -0.030 | 0.3000 | No | ||
| 57 | KIF22 | 1190368 | 9789 | -0.032 | 0.2944 | No | ||
| 58 | PTGFR | 3850373 | 10210 | -0.041 | 0.2723 | No | ||
| 59 | MCM2 | 5050139 | 11994 | -0.092 | 0.1772 | No | ||
| 60 | RAD51 | 6110450 6980280 | 12021 | -0.093 | 0.1769 | No | ||
| 61 | CX3CL1 | 3990707 | 12078 | -0.096 | 0.1751 | No | ||
| 62 | KIF20A | 2650050 | 12325 | -0.108 | 0.1631 | No | ||
| 63 | GAS6 | 4480021 | 12363 | -0.110 | 0.1625 | No | ||
| 64 | PLK1 | 1780369 2640121 | 12890 | -0.143 | 0.1358 | No | ||
| 65 | BUB1 | 5390270 | 13543 | -0.197 | 0.1030 | No | ||
| 66 | NQO1 | 3450136 6840121 | 13769 | -0.226 | 0.0936 | No | ||
| 67 | USP1 | 2760541 5690438 6220673 | 14322 | -0.302 | 0.0675 | No | ||
| 68 | LRP5 | 2100397 3170484 | 14514 | -0.333 | 0.0613 | No | ||
| 69 | MKI67 | 3440750 4480072 7050288 | 14833 | -0.398 | 0.0489 | No | ||
| 70 | CENPK | 1740722 6200068 | 14974 | -0.431 | 0.0466 | No | ||
| 71 | AQP1 | 450338 6020292 | 15312 | -0.537 | 0.0350 | No | ||
| 72 | DTYMK | 2340377 | 15444 | -0.585 | 0.0350 | No | ||
| 73 | BIRC5 | 110408 580014 1770632 | 15518 | -0.608 | 0.0384 | No | ||
| 74 | IMPDH2 | 5220138 | 15678 | -0.677 | 0.0381 | No | ||
| 75 | CSRP2 | 1030575 | 15806 | -0.742 | 0.0403 | No | ||
| 76 | MCM5 | 2680647 | 15984 | -0.836 | 0.0409 | No | ||
| 77 | TYMS | 940450 1940068 3710008 5570546 | 16034 | -0.863 | 0.0487 | No | ||
| 78 | TCF19 | 6200152 | 16331 | -1.027 | 0.0452 | No | ||
| 79 | RRM2 | 6350059 6940162 | 16418 | -1.075 | 0.0536 | No | ||
| 80 | ASF1B | 6590706 | 16915 | -1.450 | 0.0445 | No | ||
| 81 | CCNF | 6370288 | 17128 | -1.579 | 0.0523 | No | ||
| 82 | CDC20 | 3440017 3440044 6220088 | 17846 | -2.302 | 0.0415 | No |

