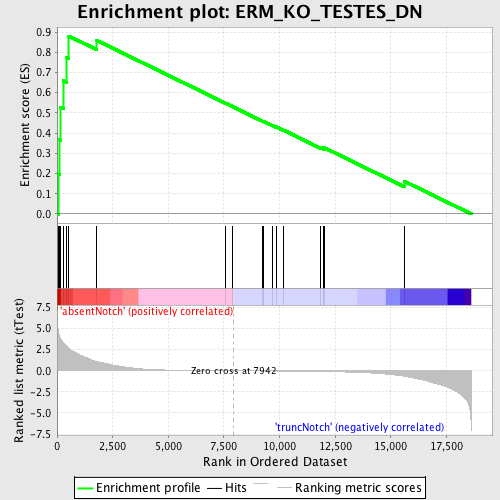
Profile of the Running ES Score & Positions of GeneSet Members on the Rank Ordered List
| Dataset | Set_03_absentNotch_versus_truncNotch.phenotype_absentNotch_versus_truncNotch.cls #absentNotch_versus_truncNotch.phenotype_absentNotch_versus_truncNotch.cls #absentNotch_versus_truncNotch_repos |
| Phenotype | phenotype_absentNotch_versus_truncNotch.cls#absentNotch_versus_truncNotch_repos |
| Upregulated in class | absentNotch |
| GeneSet | ERM_KO_TESTES_DN |
| Enrichment Score (ES) | 0.88011664 |
| Normalized Enrichment Score (NES) | 1.807756 |
| Nominal p-value | 0.0 |
| FDR q-value | 0.012411679 |
| FWER p-Value | 0.081 |
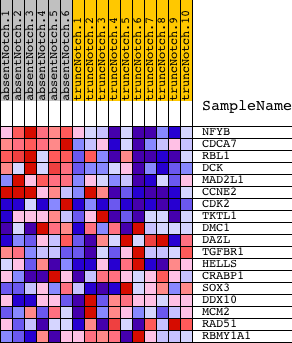
| PROBE | DESCRIPTION (from dataset) | GENE SYMBOL | GENE_TITLE | RANK IN GENE LIST | RANK METRIC SCORE | RUNNING ES | CORE ENRICHMENT | |
|---|---|---|---|---|---|---|---|---|
| 1 | NFYB | 1850053 | 49 | 4.754 | 0.1988 | Yes | ||
| 2 | CDCA7 | 3060097 | 118 | 4.044 | 0.3665 | Yes | ||
| 3 | RBL1 | 3130372 | 151 | 3.829 | 0.5271 | Yes | ||
| 4 | DCK | 6900411 | 283 | 3.283 | 0.6591 | Yes | ||
| 5 | MAD2L1 | 4480725 | 417 | 2.886 | 0.7742 | Yes | ||
| 6 | CCNE2 | 3120537 | 529 | 2.639 | 0.8801 | Yes | ||
| 7 | CDK2 | 130484 2260301 4010088 5050110 | 1778 | 1.088 | 0.8591 | No | ||
| 8 | TKTL1 | 2810672 6760102 | 7565 | 0.006 | 0.5483 | No | ||
| 9 | DMC1 | 450341 | 7875 | 0.001 | 0.5317 | No | ||
| 10 | DAZL | 4050082 | 9230 | -0.022 | 0.4598 | No | ||
| 11 | TGFBR1 | 1400148 4280020 6550711 | 9267 | -0.022 | 0.4589 | No | ||
| 12 | HELLS | 4560086 4810025 | 9678 | -0.030 | 0.4381 | No | ||
| 13 | CRABP1 | 450278 | 9839 | -0.033 | 0.4309 | No | ||
| 14 | SOX3 | 4570537 | 10159 | -0.040 | 0.4154 | No | ||
| 15 | DDX10 | 520746 | 11849 | -0.086 | 0.3283 | No | ||
| 16 | MCM2 | 5050139 | 11994 | -0.092 | 0.3244 | No | ||
| 17 | RAD51 | 6110450 6980280 | 12021 | -0.093 | 0.3270 | No | ||
| 18 | RBMY1A1 | 6200053 | 15622 | -0.650 | 0.1610 | No |