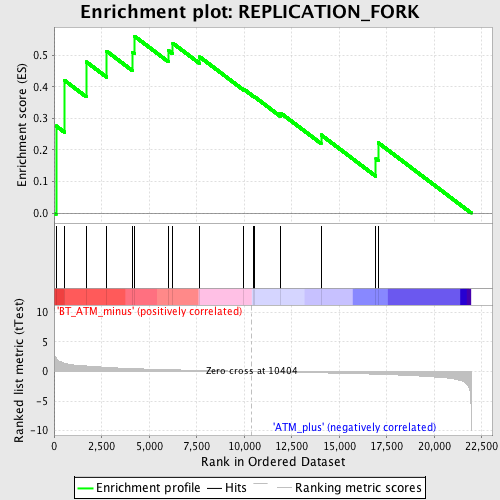
Profile of the Running ES Score & Positions of GeneSet Members on the Rank Ordered List
| Dataset | Set_02_BT_ATM_minus_versus_ATM_plus.phenotype_BT_ATM_minus_versus_ATM_plus.cls #BT_ATM_minus_versus_ATM_plus.phenotype_BT_ATM_minus_versus_ATM_plus.cls #BT_ATM_minus_versus_ATM_plus_repos |
| Phenotype | phenotype_BT_ATM_minus_versus_ATM_plus.cls#BT_ATM_minus_versus_ATM_plus_repos |
| Upregulated in class | BT_ATM_minus |
| GeneSet | REPLICATION_FORK |
| Enrichment Score (ES) | 0.5609065 |
| Normalized Enrichment Score (NES) | 1.557318 |
| Nominal p-value | 0.047034767 |
| FDR q-value | 1.0 |
| FWER p-Value | 1.0 |
| PROBE | DESCRIPTION (from dataset) | GENE SYMBOL | GENE_TITLE | RANK IN GENE LIST | RANK METRIC SCORE | RUNNING ES | CORE ENRICHMENT | |
|---|---|---|---|---|---|---|---|---|
| 1 | PURB | 1419640_at 1419641_at 1419642_at 1428254_at 1436940_at | 102 | 2.340 | 0.2762 | Yes | ||
| 2 | RFC1 | 1418342_at 1449050_at 1451920_a_at | 562 | 1.372 | 0.4199 | Yes | ||
| 3 | MCM7 | 1416030_a_at 1416031_s_at 1438320_s_at | 1699 | 0.925 | 0.4791 | Yes | ||
| 4 | CDT1 | 1424143_a_at 1424144_at 1455791_at | 2766 | 0.687 | 0.5130 | Yes | ||
| 5 | MCM3 | 1420029_at 1426653_at | 4122 | 0.482 | 0.5090 | Yes | ||
| 6 | RPA2 | 1416433_at 1454011_a_at | 4222 | 0.470 | 0.5609 | Yes | ||
| 7 | RFC5 | 1452917_at | 6006 | 0.299 | 0.5155 | No | ||
| 8 | RFC4 | 1424321_at 1438161_s_at | 6246 | 0.280 | 0.5383 | No | ||
| 9 | PCNA | 1417947_at | 7661 | 0.177 | 0.4950 | No | ||
| 10 | PURA | 1420628_at 1438219_at 1449934_at 1453783_at 1456898_at | 9977 | 0.027 | 0.3926 | No | ||
| 11 | POLA1 | 1419397_at 1456285_at 1459319_at 1459963_at | 10480 | -0.004 | 0.3703 | No | ||
| 12 | RPA3 | 1448938_at | 10539 | -0.008 | 0.3686 | No | ||
| 13 | BCL6 | 1421818_at 1450381_a_at | 11919 | -0.094 | 0.3170 | No | ||
| 14 | RFC2 | 1417503_at 1457638_x_at 1457669_x_at | 14043 | -0.230 | 0.2478 | No | ||
| 15 | RPA1 | 1423293_at 1437309_a_at 1441240_at | 16927 | -0.461 | 0.1716 | No | ||
| 16 | RFC3 | 1423700_at 1432538_a_at | 17047 | -0.473 | 0.2230 | No |

