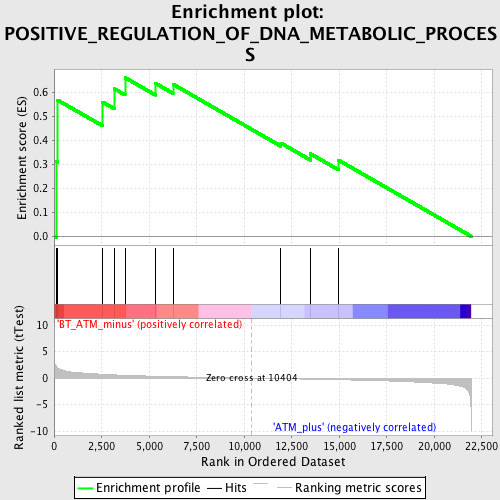
Profile of the Running ES Score & Positions of GeneSet Members on the Rank Ordered List
| Dataset | Set_02_BT_ATM_minus_versus_ATM_plus.phenotype_BT_ATM_minus_versus_ATM_plus.cls #BT_ATM_minus_versus_ATM_plus.phenotype_BT_ATM_minus_versus_ATM_plus.cls #BT_ATM_minus_versus_ATM_plus_repos |
| Phenotype | phenotype_BT_ATM_minus_versus_ATM_plus.cls#BT_ATM_minus_versus_ATM_plus_repos |
| Upregulated in class | BT_ATM_minus |
| GeneSet | POSITIVE_REGULATION_OF_DNA_METABOLIC_PROCESS |
| Enrichment Score (ES) | 0.66296154 |
| Normalized Enrichment Score (NES) | 1.6437101 |
| Nominal p-value | 0.018058691 |
| FDR q-value | 1.0 |
| FWER p-Value | 1.0 |
| PROBE | DESCRIPTION (from dataset) | GENE SYMBOL | GENE_TITLE | RANK IN GENE LIST | RANK METRIC SCORE | RUNNING ES | CORE ENRICHMENT | |
|---|---|---|---|---|---|---|---|---|
| 1 | TGFB1 | 1420653_at 1445360_at | 106 | 2.330 | 0.3127 | Yes | ||
| 2 | CEBPG | 1425261_at 1425262_at 1451639_at | 196 | 1.906 | 0.5684 | Yes | ||
| 3 | GLI2 | 1446086_s_at 1459211_at | 2547 | 0.731 | 0.5608 | Yes | ||
| 4 | GLI1 | 1449058_at | 3184 | 0.614 | 0.6155 | Yes | ||
| 5 | PPARGC1A | 1434099_at 1434100_x_at 1437751_at 1456395_at 1460336_at | 3731 | 0.531 | 0.6630 | Yes | ||
| 6 | IL4 | 1449864_at | 5329 | 0.360 | 0.6392 | No | ||
| 7 | UBE2N | 1422559_at 1435384_at | 6255 | 0.280 | 0.6351 | No | ||
| 8 | EREG | 1419431_at | 11930 | -0.095 | 0.3893 | No | ||
| 9 | RAD51 | 1418281_at | 13482 | -0.193 | 0.3449 | No | ||
| 10 | TNFSF13 | 1445227_at | 14971 | -0.298 | 0.3176 | No |

