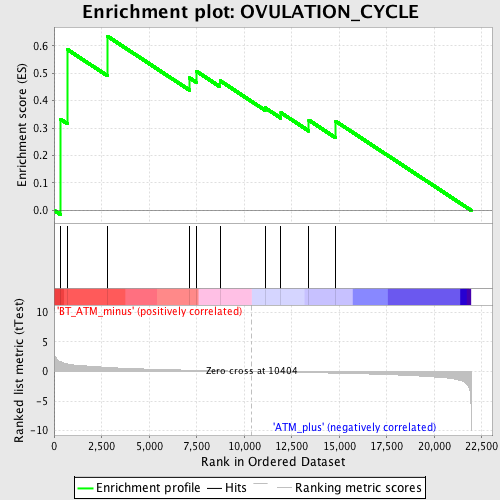
Profile of the Running ES Score & Positions of GeneSet Members on the Rank Ordered List
| Dataset | Set_02_BT_ATM_minus_versus_ATM_plus.phenotype_BT_ATM_minus_versus_ATM_plus.cls #BT_ATM_minus_versus_ATM_plus.phenotype_BT_ATM_minus_versus_ATM_plus.cls #BT_ATM_minus_versus_ATM_plus_repos |
| Phenotype | phenotype_BT_ATM_minus_versus_ATM_plus.cls#BT_ATM_minus_versus_ATM_plus_repos |
| Upregulated in class | BT_ATM_minus |
| GeneSet | OVULATION_CYCLE |
| Enrichment Score (ES) | 0.6350359 |
| Normalized Enrichment Score (NES) | 1.5347961 |
| Nominal p-value | 0.027777778 |
| FDR q-value | 1.0 |
| FWER p-Value | 1.0 |
| PROBE | DESCRIPTION (from dataset) | GENE SYMBOL | GENE_TITLE | RANK IN GENE LIST | RANK METRIC SCORE | RUNNING ES | CORE ENRICHMENT | |
|---|---|---|---|---|---|---|---|---|
| 1 | EIF2B5 | 1433886_at 1445908_at | 328 | 1.644 | 0.3328 | Yes | ||
| 2 | SOD1 | 1435304_at 1440222_at 1440896_at 1451124_at 1459976_s_at | 693 | 1.278 | 0.5866 | Yes | ||
| 3 | SPRR2F | 1449833_at | 2799 | 0.682 | 0.6350 | Yes | ||
| 4 | BMPR1B | 1422872_at 1437312_at 1443720_s_at | 7130 | 0.214 | 0.4828 | No | ||
| 5 | EIF2B2 | 1434538_x_at 1437428_x_at 1451136_a_at | 7472 | 0.190 | 0.5075 | No | ||
| 6 | SPRR2D | 1420771_at | 8725 | 0.105 | 0.4727 | No | ||
| 7 | SPRR2A | 1437258_at 1439016_x_at 1450618_a_at | 11098 | -0.044 | 0.3738 | No | ||
| 8 | EREG | 1419431_at | 11930 | -0.095 | 0.3560 | No | ||
| 9 | FOXL2 | 1444002_at | 13400 | -0.188 | 0.3286 | No | ||
| 10 | EIF2B4 | 1449940_a_at | 14799 | -0.286 | 0.3254 | No |

