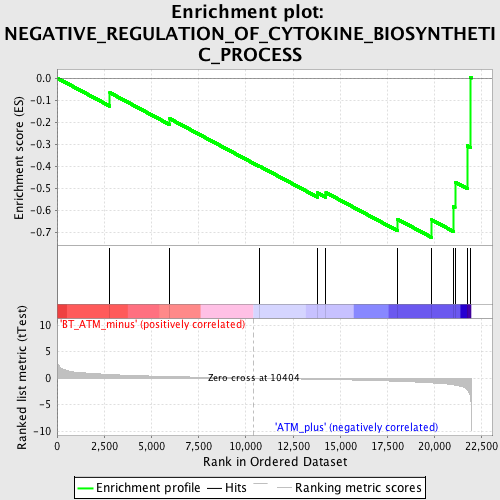
Profile of the Running ES Score & Positions of GeneSet Members on the Rank Ordered List
| Dataset | Set_02_BT_ATM_minus_versus_ATM_plus.phenotype_BT_ATM_minus_versus_ATM_plus.cls #BT_ATM_minus_versus_ATM_plus.phenotype_BT_ATM_minus_versus_ATM_plus.cls #BT_ATM_minus_versus_ATM_plus_repos |
| Phenotype | phenotype_BT_ATM_minus_versus_ATM_plus.cls#BT_ATM_minus_versus_ATM_plus_repos |
| Upregulated in class | ATM_plus |
| GeneSet | NEGATIVE_REGULATION_OF_CYTOKINE_BIOSYNTHETIC_PROCESS |
| Enrichment Score (ES) | -0.72183037 |
| Normalized Enrichment Score (NES) | -1.7539679 |
| Nominal p-value | 0.00528169 |
| FDR q-value | 0.21307963 |
| FWER p-Value | 0.958 |
| PROBE | DESCRIPTION (from dataset) | GENE SYMBOL | GENE_TITLE | RANK IN GENE LIST | RANK METRIC SCORE | RUNNING ES | CORE ENRICHMENT | |
|---|---|---|---|---|---|---|---|---|
| 1 | INHBB | 1426858_at 1426859_at | 2795 | 0.683 | -0.0666 | No | ||
| 2 | GHSR | 1446756_at | 5970 | 0.302 | -0.1843 | No | ||
| 3 | INHA | 1422728_at | 10732 | -0.019 | -0.3998 | No | ||
| 4 | IL6 | 1450297_at | 13790 | -0.213 | -0.5202 | No | ||
| 5 | GHRL | 1448980_at | 14238 | -0.244 | -0.5187 | No | ||
| 6 | SFTPD | 1420378_at | 18018 | -0.585 | -0.6389 | No | ||
| 7 | ELA2 | 1422928_at | 19838 | -0.893 | -0.6421 | Yes | ||
| 8 | SIGIRR | 1449163_at | 20982 | -1.245 | -0.5832 | Yes | ||
| 9 | INHBA | 1422053_at 1458291_at | 21074 | -1.299 | -0.4714 | Yes | ||
| 10 | FOXP3 | 1420765_a_at 1457082_at | 21728 | -2.176 | -0.3070 | Yes | ||
| 11 | BCL3 | 1418133_at | 21891 | -3.545 | 0.0020 | Yes |

