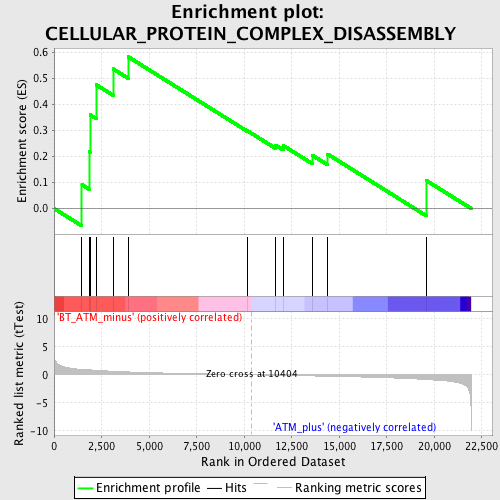
Profile of the Running ES Score & Positions of GeneSet Members on the Rank Ordered List
| Dataset | Set_02_BT_ATM_minus_versus_ATM_plus.phenotype_BT_ATM_minus_versus_ATM_plus.cls #BT_ATM_minus_versus_ATM_plus.phenotype_BT_ATM_minus_versus_ATM_plus.cls #BT_ATM_minus_versus_ATM_plus_repos |
| Phenotype | phenotype_BT_ATM_minus_versus_ATM_plus.cls#BT_ATM_minus_versus_ATM_plus_repos |
| Upregulated in class | BT_ATM_minus |
| GeneSet | CELLULAR_PROTEIN_COMPLEX_DISASSEMBLY |
| Enrichment Score (ES) | 0.58164114 |
| Normalized Enrichment Score (NES) | 1.5032835 |
| Nominal p-value | 0.07188161 |
| FDR q-value | 1.0 |
| FWER p-Value | 1.0 |
| PROBE | DESCRIPTION (from dataset) | GENE SYMBOL | GENE_TITLE | RANK IN GENE LIST | RANK METRIC SCORE | RUNNING ES | CORE ENRICHMENT | |
|---|---|---|---|---|---|---|---|---|
| 1 | MTERF | 1429698_at | 1465 | 0.977 | 0.0914 | Yes | ||
| 2 | HRSP12 | 1419348_at 1428326_s_at | 1838 | 0.893 | 0.2190 | Yes | ||
| 3 | SET | 1426853_at 1426854_a_at | 1892 | 0.881 | 0.3592 | Yes | ||
| 4 | HMGA1 | 1416184_s_at | 2222 | 0.804 | 0.4743 | Yes | ||
| 5 | SUPT16H | 1419741_at 1449578_at 1456449_at | 3107 | 0.625 | 0.5353 | Yes | ||
| 6 | ETF1 | 1420023_at 1420024_s_at 1424013_at 1440629_at 1451208_at | 3901 | 0.510 | 0.5816 | Yes | ||
| 7 | SMARCE1 | 1422675_at 1422676_at 1430822_at | 10175 | 0.014 | 0.2978 | No | ||
| 8 | MAZ | 1427099_at | 11658 | -0.078 | 0.2428 | No | ||
| 9 | UPF1 | 1419685_at | 12059 | -0.102 | 0.2411 | No | ||
| 10 | NRG1 | 1456524_at | 13601 | -0.201 | 0.2033 | No | ||
| 11 | TTF2 | 1428522_at 1447119_at 1452818_at | 14382 | -0.254 | 0.2089 | No | ||
| 12 | TNP1 | 1415924_at 1438632_x_at | 19573 | -0.837 | 0.1077 | No |

