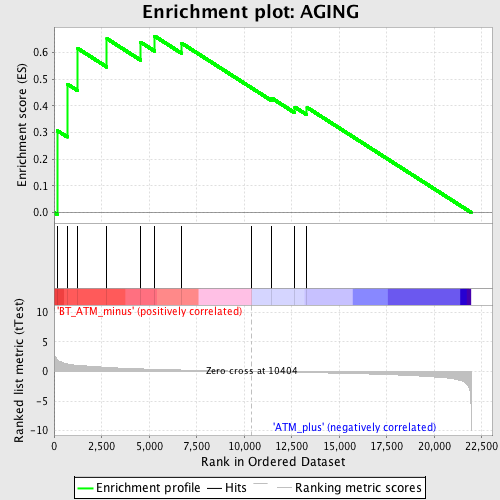
Profile of the Running ES Score & Positions of GeneSet Members on the Rank Ordered List
| Dataset | Set_02_BT_ATM_minus_versus_ATM_plus.phenotype_BT_ATM_minus_versus_ATM_plus.cls #BT_ATM_minus_versus_ATM_plus.phenotype_BT_ATM_minus_versus_ATM_plus.cls #BT_ATM_minus_versus_ATM_plus_repos |
| Phenotype | phenotype_BT_ATM_minus_versus_ATM_plus.cls#BT_ATM_minus_versus_ATM_plus_repos |
| Upregulated in class | BT_ATM_minus |
| GeneSet | AGING |
| Enrichment Score (ES) | 0.6607889 |
| Normalized Enrichment Score (NES) | 1.6763772 |
| Nominal p-value | 0.017204301 |
| FDR q-value | 1.0 |
| FWER p-Value | 0.998 |
| PROBE | DESCRIPTION (from dataset) | GENE SYMBOL | GENE_TITLE | RANK IN GENE LIST | RANK METRIC SCORE | RUNNING ES | CORE ENRICHMENT | |
|---|---|---|---|---|---|---|---|---|
| 1 | TP53 | 1426538_a_at 1427739_a_at 1438808_at 1457623_x_at 1459780_at 1459781_x_at | 161 | 2.024 | 0.3071 | Yes | ||
| 2 | SOD1 | 1435304_at 1440222_at 1440896_at 1451124_at 1459976_s_at | 693 | 1.278 | 0.4814 | Yes | ||
| 3 | KL | 1423400_at 1451892_at | 1248 | 1.019 | 0.6145 | Yes | ||
| 4 | LIMS1 | 1418230_a_at 1418231_at 1418232_s_at 1441411_at 1443947_at | 2778 | 0.686 | 0.6513 | Yes | ||
| 5 | PDCD4 | 1444171_at | 4557 | 0.434 | 0.6377 | Yes | ||
| 6 | NPM1 | 1415839_a_at 1420267_at 1420268_x_at 1420269_at 1432416_a_at | 5290 | 0.363 | 0.6608 | Yes | ||
| 7 | GPR175 | 1460276_a_at | 6701 | 0.246 | 0.6347 | No | ||
| 8 | NOX4 | 1419161_a_at 1451827_a_at | 10386 | 0.001 | 0.4668 | No | ||
| 9 | CDKN2A | 1450140_a_at | 11446 | -0.065 | 0.4286 | No | ||
| 10 | TBX3 | 1437479_x_at 1439567_at 1444594_at 1445757_at 1448029_at | 12664 | -0.139 | 0.3947 | No | ||
| 11 | LOXL2 | 1431004_at 1452436_at | 13300 | -0.181 | 0.3938 | No |

