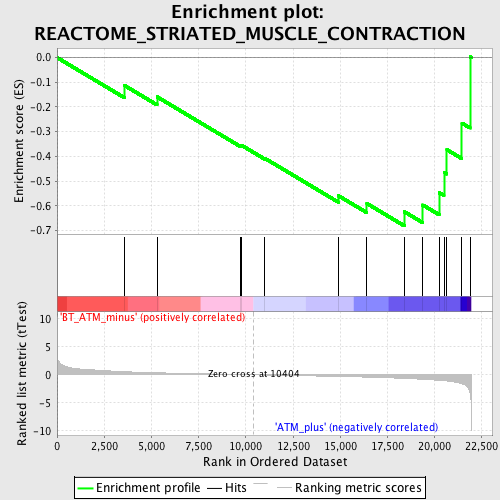
Profile of the Running ES Score & Positions of GeneSet Members on the Rank Ordered List
| Dataset | Set_02_BT_ATM_minus_versus_ATM_plus.phenotype_BT_ATM_minus_versus_ATM_plus.cls #BT_ATM_minus_versus_ATM_plus.phenotype_BT_ATM_minus_versus_ATM_plus.cls #BT_ATM_minus_versus_ATM_plus_repos |
| Phenotype | phenotype_BT_ATM_minus_versus_ATM_plus.cls#BT_ATM_minus_versus_ATM_plus_repos |
| Upregulated in class | ATM_plus |
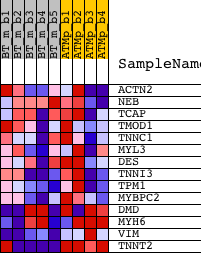
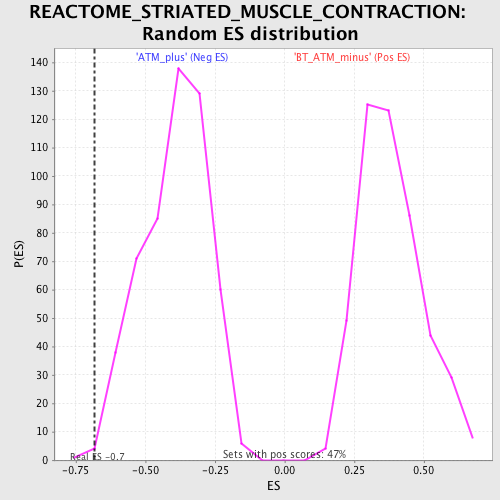
| GeneSet | REACTOME_STRIATED_MUSCLE_CONTRACTION |
| Enrichment Score (ES) | -0.6817438 |
| Normalized Enrichment Score (NES) | -1.7295691 |
| Nominal p-value | 0.0056390977 |
| FDR q-value | 0.1928689 |
| FWER p-Value | 0.919 |
| PROBE | DESCRIPTION (from dataset) | GENE SYMBOL | GENE_TITLE | RANK IN GENE LIST | RANK METRIC SCORE | RUNNING ES | CORE ENRICHMENT | |
|---|---|---|---|---|---|---|---|---|
| 1 | ACTN2 | 1448327_at 1456968_at | 3572 | 0.553 | -0.1132 | No | ||
| 2 | NEB | 1435355_at | 5292 | 0.363 | -0.1589 | No | ||
| 3 | TCAP | 1423145_a_at | 9698 | 0.045 | -0.3557 | No | ||
| 4 | TMOD1 | 1419863_at 1422754_at | 9761 | 0.042 | -0.3548 | No | ||
| 5 | TNNC1 | 1418370_at | 10996 | -0.038 | -0.4077 | No | ||
| 6 | MYL3 | 1427768_s_at 1427769_x_at 1428266_at | 14909 | -0.293 | -0.5598 | No | ||
| 7 | DES | 1426731_at | 16407 | -0.412 | -0.5909 | No | ||
| 8 | TNNI3 | 1422536_at | 18399 | -0.637 | -0.6244 | Yes | ||
| 9 | TPM1 | 1423049_a_at 1423721_at 1447713_at 1456623_at | 19366 | -0.796 | -0.5968 | Yes | ||
| 10 | MYBPC2 | 1455736_at | 20231 | -0.992 | -0.5469 | Yes | ||
| 11 | DMD | 1417307_at 1430320_at 1446156_at 1448665_at 1457022_at | 20490 | -1.047 | -0.4644 | Yes | ||
| 12 | MYH6 | 1417729_at 1448826_at 1458850_at | 20645 | -1.091 | -0.3731 | Yes | ||
| 13 | VIM | 1438118_x_at 1450641_at 1456292_a_at | 21441 | -1.597 | -0.2656 | Yes | ||
| 14 | TNNT2 | 1418726_a_at 1424967_x_at 1440424_at | 21869 | -3.198 | 0.0030 | Yes |