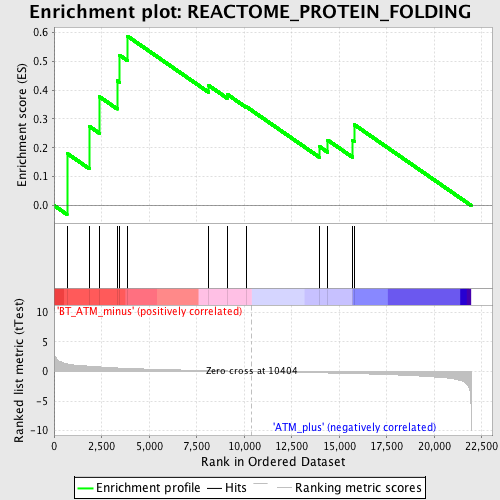
Profile of the Running ES Score & Positions of GeneSet Members on the Rank Ordered List
| Dataset | Set_02_BT_ATM_minus_versus_ATM_plus.phenotype_BT_ATM_minus_versus_ATM_plus.cls #BT_ATM_minus_versus_ATM_plus.phenotype_BT_ATM_minus_versus_ATM_plus.cls #BT_ATM_minus_versus_ATM_plus_repos |
| Phenotype | phenotype_BT_ATM_minus_versus_ATM_plus.cls#BT_ATM_minus_versus_ATM_plus_repos |
| Upregulated in class | BT_ATM_minus |
| GeneSet | REACTOME_PROTEIN_FOLDING |
| Enrichment Score (ES) | 0.58705616 |
| Normalized Enrichment Score (NES) | 1.5743284 |
| Nominal p-value | 0.030023094 |
| FDR q-value | 0.52059734 |
| FWER p-Value | 0.998 |
| PROBE | DESCRIPTION (from dataset) | GENE SYMBOL | GENE_TITLE | RANK IN GENE LIST | RANK METRIC SCORE | RUNNING ES | CORE ENRICHMENT | |
|---|---|---|---|---|---|---|---|---|
| 1 | CCT3 | 1416024_x_at 1426067_x_at 1439679_at 1448178_a_at 1449645_s_at 1451915_at 1459987_s_at | 680 | 1.284 | 0.1809 | Yes | ||
| 2 | CCT4 | 1415867_at 1415868_at 1430034_at 1433447_x_at 1438560_x_at 1442569_at 1456082_x_at 1456572_x_at | 1848 | 0.890 | 0.2746 | Yes | ||
| 3 | CCT6A | 1423517_at 1455988_a_at | 2374 | 0.770 | 0.3777 | Yes | ||
| 4 | TBCE | 1428282_at 1445668_at | 3324 | 0.591 | 0.4320 | Yes | ||
| 5 | VBP1 | 1421750_a_at | 3445 | 0.570 | 0.5207 | Yes | ||
| 6 | TBCC | 1424644_at 1451423_at | 3857 | 0.515 | 0.5871 | Yes | ||
| 7 | TBCA | 1417652_a_at 1437907_a_at 1456205_x_at | 8122 | 0.145 | 0.4165 | No | ||
| 8 | PFDN1 | 1417026_at | 9101 | 0.083 | 0.3855 | No | ||
| 9 | PFDN6 | 1415744_at | 10122 | 0.017 | 0.3419 | No | ||
| 10 | CCT8 | 1415785_a_at 1436973_at | 13974 | -0.226 | 0.2036 | No | ||
| 11 | CCT2 | 1416037_a_at 1433534_a_at 1433535_x_at | 14393 | -0.255 | 0.2267 | No | ||
| 12 | ACTB | 1419734_at 1436722_a_at 1440365_at AFFX-b-ActinMur/M12481_3_at AFFX-b-ActinMur/M12481_5_at AFFX-b-ActinMur/M12481_M_at | 15686 | -0.351 | 0.2256 | No | ||
| 13 | CCT5 | 1417258_at | 15795 | -0.359 | 0.2800 | No |

