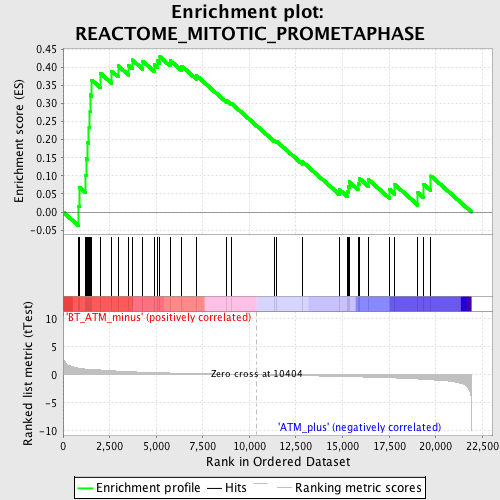
Profile of the Running ES Score & Positions of GeneSet Members on the Rank Ordered List
| Dataset | Set_02_BT_ATM_minus_versus_ATM_plus.phenotype_BT_ATM_minus_versus_ATM_plus.cls #BT_ATM_minus_versus_ATM_plus.phenotype_BT_ATM_minus_versus_ATM_plus.cls #BT_ATM_minus_versus_ATM_plus_repos |
| Phenotype | phenotype_BT_ATM_minus_versus_ATM_plus.cls#BT_ATM_minus_versus_ATM_plus_repos |
| Upregulated in class | BT_ATM_minus |
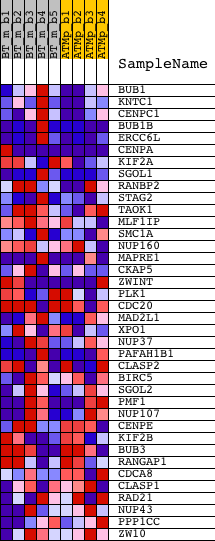
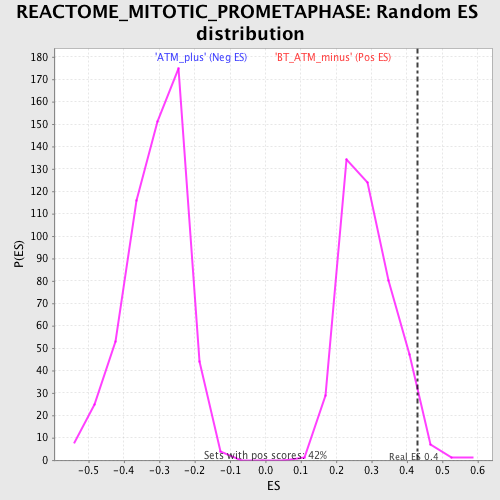
| GeneSet | REACTOME_MITOTIC_PROMETAPHASE |
| Enrichment Score (ES) | 0.42883652 |
| Normalized Enrichment Score (NES) | 1.4886669 |
| Nominal p-value | 0.03301887 |
| FDR q-value | 0.6288712 |
| FWER p-Value | 1.0 |
| PROBE | DESCRIPTION (from dataset) | GENE SYMBOL | GENE_TITLE | RANK IN GENE LIST | RANK METRIC SCORE | RUNNING ES | CORE ENRICHMENT | |
|---|---|---|---|---|---|---|---|---|
| 1 | BUB1 | 1424046_at 1438571_at | 844 | 1.170 | 0.0161 | Yes | ||
| 2 | KNTC1 | 1435575_at | 876 | 1.156 | 0.0687 | Yes | ||
| 3 | CENPC1 | 1420441_at | 1198 | 1.032 | 0.1022 | Yes | ||
| 4 | BUB1B | 1416961_at 1447362_at 1447363_s_at | 1236 | 1.023 | 0.1483 | Yes | ||
| 5 | ERCC6L | 1424766_at 1444024_at | 1300 | 1.010 | 0.1926 | Yes | ||
| 6 | CENPA | 1441864_x_at 1444416_at 1450842_a_at | 1389 | 0.993 | 0.2349 | Yes | ||
| 7 | KIF2A | 1432072_at 1450052_at 1450053_at 1452499_a_at 1454107_a_at | 1442 | 0.981 | 0.2784 | Yes | ||
| 8 | SGOL1 | 1418919_at 1439510_at | 1450 | 0.980 | 0.3238 | Yes | ||
| 9 | RANBP2 | 1422621_at 1440104_at 1445883_at 1450690_at | 1542 | 0.960 | 0.3645 | Yes | ||
| 10 | STAG2 | 1421849_at 1450396_at | 1991 | 0.857 | 0.3841 | Yes | ||
| 11 | TAOK1 | 1424657_at 1424658_at 1426357_at 1426358_at 1444385_at 1455432_at 1456975_at 1459770_at | 2615 | 0.717 | 0.3891 | Yes | ||
| 12 | MLF1IP | 1428518_at 1452816_at | 2964 | 0.654 | 0.4038 | Yes | ||
| 13 | SMC1A | 1417830_at 1417831_at 1417832_at | 3520 | 0.561 | 0.4046 | Yes | ||
| 14 | NUP160 | 1418530_at 1444892_at | 3723 | 0.532 | 0.4202 | Yes | ||
| 15 | MAPRE1 | 1422764_at 1422765_at 1428819_at 1428820_at 1450740_a_at | 4281 | 0.464 | 0.4165 | Yes | ||
| 16 | CKAP5 | 1430647_at 1437349_at 1442271_at | 4889 | 0.402 | 0.4075 | Yes | ||
| 17 | ZWINT | 1423724_at 1427539_a_at 1427540_at 1429786_a_at 1429787_x_at 1444717_at 1455382_at | 5046 | 0.386 | 0.4184 | Yes | ||
| 18 | PLK1 | 1443408_at 1448191_at 1459616_at | 5199 | 0.371 | 0.4288 | Yes | ||
| 19 | CDC20 | 1416664_at 1439377_x_at 1439394_x_at | 5751 | 0.322 | 0.4187 | No | ||
| 20 | MAD2L1 | 1422460_at | 6367 | 0.271 | 0.4033 | No | ||
| 21 | XPO1 | 1418442_at 1418443_at 1448070_at | 7177 | 0.210 | 0.3762 | No | ||
| 22 | NUP37 | 1423969_at | 8791 | 0.102 | 0.3073 | No | ||
| 23 | PAFAH1B1 | 1417086_at 1427703_at 1439656_at 1441404_at 1444125_at 1448578_at 1456947_at 1460199_a_at | 9016 | 0.089 | 0.3012 | No | ||
| 24 | CLASP2 | 1424836_a_at 1427328_a_at 1429976_at 1440802_at 1441726_at 1443320_at 1456911_at | 11331 | -0.058 | 0.1983 | No | ||
| 25 | BIRC5 | 1424278_a_at | 11464 | -0.066 | 0.1953 | No | ||
| 26 | SGOL2 | 1437370_at | 12840 | -0.152 | 0.1396 | No | ||
| 27 | PMF1 | 1416707_a_at 1438173_x_at | 14850 | -0.289 | 0.0613 | No | ||
| 28 | NUP107 | 1426751_s_at | 15269 | -0.320 | 0.0572 | No | ||
| 29 | CENPE | 1435005_at 1439040_at | 15324 | -0.323 | 0.0698 | No | ||
| 30 | KIF2B | 1429333_at | 15363 | -0.326 | 0.0833 | No | ||
| 31 | BUB3 | 1416815_s_at 1448058_s_at 1448473_at 1459104_at 1459918_at | 15839 | -0.363 | 0.0786 | No | ||
| 32 | RANGAP1 | 1423749_s_at 1444581_at 1451092_a_at | 15903 | -0.369 | 0.0929 | No | ||
| 33 | CDCA8 | 1428480_at 1428481_s_at 1436847_s_at | 16400 | -0.411 | 0.0895 | No | ||
| 34 | CLASP1 | 1427353_at 1452265_at 1459233_at 1460102_at | 17542 | -0.526 | 0.0619 | No | ||
| 35 | RAD21 | 1416161_at 1416162_at 1455938_x_at | 17818 | -0.558 | 0.0755 | No | ||
| 36 | NUP43 | 1432187_at 1432188_s_at | 19052 | -0.738 | 0.0536 | No | ||
| 37 | PPP1CC | 1440594_at | 19363 | -0.795 | 0.0766 | No | ||
| 38 | ZW10 | 1424891_a_at 1431747_at 1445206_at | 19753 | -0.873 | 0.0996 | No |