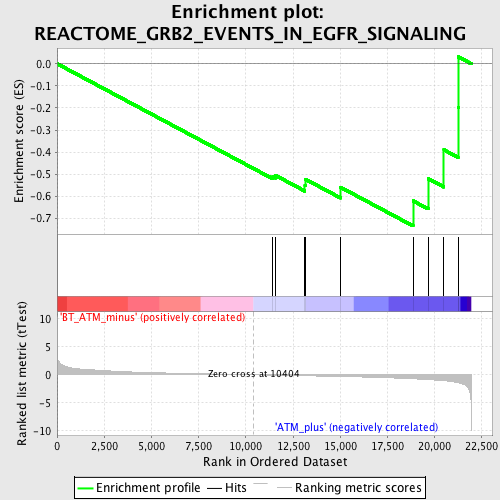
Profile of the Running ES Score & Positions of GeneSet Members on the Rank Ordered List
| Dataset | Set_02_BT_ATM_minus_versus_ATM_plus.phenotype_BT_ATM_minus_versus_ATM_plus.cls #BT_ATM_minus_versus_ATM_plus.phenotype_BT_ATM_minus_versus_ATM_plus.cls #BT_ATM_minus_versus_ATM_plus_repos |
| Phenotype | phenotype_BT_ATM_minus_versus_ATM_plus.cls#BT_ATM_minus_versus_ATM_plus_repos |
| Upregulated in class | ATM_plus |
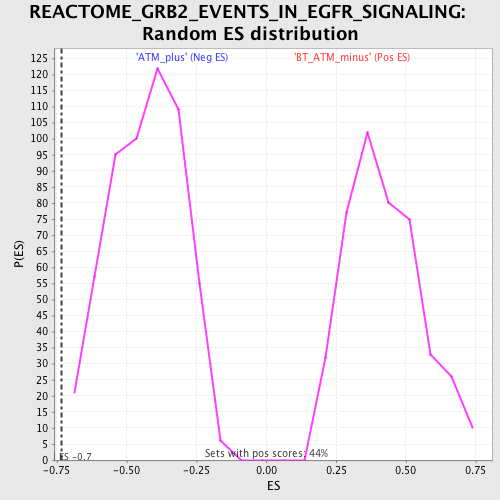
| GeneSet | REACTOME_GRB2_EVENTS_IN_EGFR_SIGNALING |
| Enrichment Score (ES) | -0.734387 |
| Normalized Enrichment Score (NES) | -1.7057787 |
| Nominal p-value | 0.0 |
| FDR q-value | 0.21928217 |
| FWER p-Value | 0.954 |
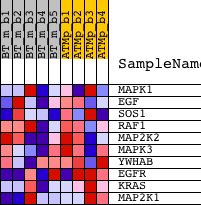
| PROBE | DESCRIPTION (from dataset) | GENE SYMBOL | GENE_TITLE | RANK IN GENE LIST | RANK METRIC SCORE | RUNNING ES | CORE ENRICHMENT | |
|---|---|---|---|---|---|---|---|---|
| 1 | MAPK1 | 1419568_at 1426585_s_at 1442876_at 1453104_at | 11428 | -0.064 | -0.5110 | No | ||
| 2 | EGF | 1418093_a_at | 11572 | -0.072 | -0.5058 | No | ||
| 3 | SOS1 | 1421884_at 1421885_at 1421886_at | 13126 | -0.170 | -0.5494 | No | ||
| 4 | RAF1 | 1416078_s_at 1425419_a_at | 13151 | -0.171 | -0.5229 | No | ||
| 5 | MAP2K2 | 1415974_at 1443436_at 1460636_at | 15015 | -0.301 | -0.5594 | No | ||
| 6 | MAPK3 | 1427060_at | 18852 | -0.706 | -0.6208 | Yes | ||
| 7 | YWHAB | 1420878_a_at 1420879_a_at 1420880_a_at 1436783_x_at 1438708_x_at 1455815_a_at | 19654 | -0.852 | -0.5202 | Yes | ||
| 8 | EGFR | 1424932_at 1432647_at 1435888_at 1451530_at 1454313_at 1457563_at 1460420_a_at | 20486 | -1.045 | -0.3899 | Yes | ||
| 9 | KRAS | 1426228_at 1426229_s_at 1434000_at 1451979_at | 21237 | -1.408 | -0.1975 | Yes | ||
| 10 | MAP2K1 | 1416351_at | 21251 | -1.424 | 0.0312 | Yes |