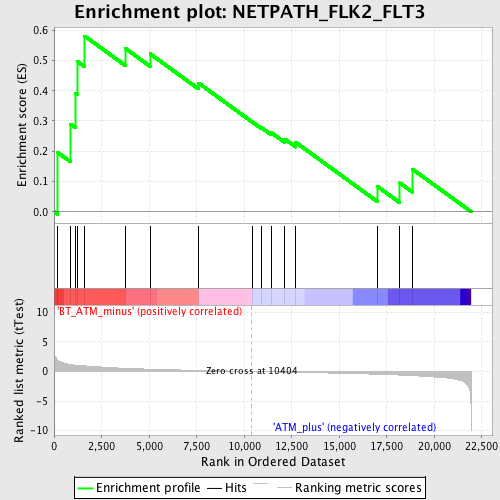
Profile of the Running ES Score & Positions of GeneSet Members on the Rank Ordered List
| Dataset | Set_02_BT_ATM_minus_versus_ATM_plus.phenotype_BT_ATM_minus_versus_ATM_plus.cls #BT_ATM_minus_versus_ATM_plus.phenotype_BT_ATM_minus_versus_ATM_plus.cls #BT_ATM_minus_versus_ATM_plus_repos |
| Phenotype | phenotype_BT_ATM_minus_versus_ATM_plus.cls#BT_ATM_minus_versus_ATM_plus_repos |
| Upregulated in class | BT_ATM_minus |
| GeneSet | NETPATH_FLK2_FLT3 |
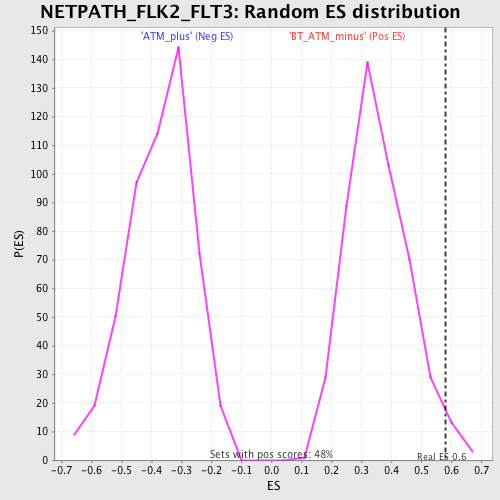
| Enrichment Score (ES) | 0.58046305 |
| Normalized Enrichment Score (NES) | 1.6198285 |
| Nominal p-value | 0.021008404 |
| FDR q-value | 0.5782735 |
| FWER p-Value | 0.996 |
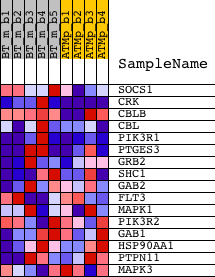
| PROBE | DESCRIPTION (from dataset) | GENE SYMBOL | GENE_TITLE | RANK IN GENE LIST | RANK METRIC SCORE | RUNNING ES | CORE ENRICHMENT | |
|---|---|---|---|---|---|---|---|---|
| 1 | SOCS1 | 1440047_at 1450446_a_at | 198 | 1.904 | 0.1953 | Yes | ||
| 2 | CRK | 1416201_at 1425855_a_at 1436835_at 1448248_at 1460176_at | 864 | 1.161 | 0.2895 | Yes | ||
| 3 | CBLB | 1437304_at 1455082_at 1458469_at | 1123 | 1.052 | 0.3907 | Yes | ||
| 4 | CBL | 1434829_at 1446608_at 1450457_at 1455886_at | 1207 | 1.030 | 0.4975 | Yes | ||
| 5 | PIK3R1 | 1425514_at 1425515_at 1438682_at 1444591_at 1451737_at | 1613 | 0.946 | 0.5805 | Yes | ||
| 6 | PTGES3 | 1417998_at 1460221_at | 3741 | 0.529 | 0.5402 | No | ||
| 7 | GRB2 | 1418508_a_at 1449111_a_at | 5050 | 0.386 | 0.5220 | No | ||
| 8 | SHC1 | 1422853_at 1422854_at | 7599 | 0.182 | 0.4252 | No | ||
| 9 | GAB2 | 1419829_a_at 1420785_at 1439786_at 1446860_at | 10443 | -0.002 | 0.2958 | No | ||
| 10 | FLT3 | 1419538_at | 10881 | -0.031 | 0.2791 | No | ||
| 11 | MAPK1 | 1419568_at 1426585_s_at 1442876_at 1453104_at | 11428 | -0.064 | 0.2610 | No | ||
| 12 | PIK3R2 | 1418463_at | 12133 | -0.106 | 0.2403 | No | ||
| 13 | GAB1 | 1417693_a_at 1417694_at 1448814_at | 12712 | -0.143 | 0.2293 | No | ||
| 14 | HSP90AA1 | 1426645_at 1437497_a_at 1438902_a_at 1455078_at | 17002 | -0.469 | 0.0839 | No | ||
| 15 | PTPN11 | 1421196_at 1427699_a_at 1451225_at | 18189 | -0.608 | 0.0951 | No | ||
| 16 | MAPK3 | 1427060_at | 18852 | -0.706 | 0.1406 | No |