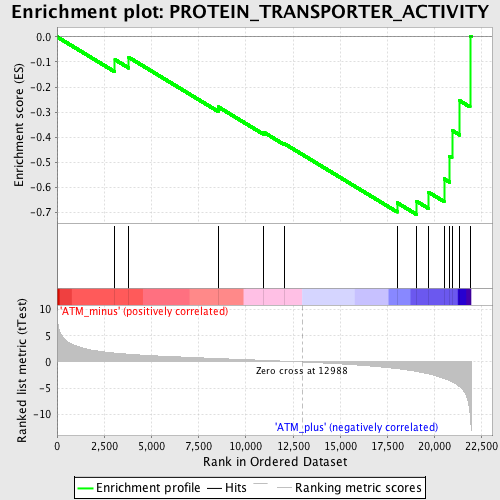
Profile of the Running ES Score & Positions of GeneSet Members on the Rank Ordered List
| Dataset | Set_02_ATM_minus_versus_ATM_plus.phenotype_ATM_minus_versus_ATM_plus.cls #ATM_minus_versus_ATM_plus.phenotype_ATM_minus_versus_ATM_plus.cls #ATM_minus_versus_ATM_plus_repos |
| Phenotype | phenotype_ATM_minus_versus_ATM_plus.cls#ATM_minus_versus_ATM_plus_repos |
| Upregulated in class | ATM_plus |
| GeneSet | PROTEIN_TRANSPORTER_ACTIVITY |
| Enrichment Score (ES) | -0.7079481 |
| Normalized Enrichment Score (NES) | -1.7127777 |
| Nominal p-value | 0.0038387715 |
| FDR q-value | 0.26417616 |
| FWER p-Value | 0.979 |

| PROBE | DESCRIPTION (from dataset) | GENE SYMBOL | GENE_TITLE | RANK IN GENE LIST | RANK METRIC SCORE | RUNNING ES | CORE ENRICHMENT | |
|---|---|---|---|---|---|---|---|---|
| 1 | XPO6 | 1422759_a_at 1440492_at 1443737_at | 3064 | 1.694 | -0.0908 | No | ||
| 2 | SEC61B | 1417083_at | 3798 | 1.477 | -0.0816 | No | ||
| 3 | CCT6B | 1419227_at | 8537 | 0.642 | -0.2792 | No | ||
| 4 | COG1 | 1418354_at 1433774_x_at 1437844_x_at 1449053_s_at 1456740_x_at | 10952 | 0.306 | -0.3804 | No | ||
| 5 | ZFYVE16 | 1447947_at | 12028 | 0.147 | -0.4252 | No | ||
| 6 | IPO9 | 1424466_at 1439481_at 1441645_s_at | 18011 | -1.279 | -0.6611 | Yes | ||
| 7 | TSNAX | 1423395_at 1430045_at | 19038 | -1.822 | -0.6553 | Yes | ||
| 8 | COG2 | 1416932_at | 19656 | -2.247 | -0.6185 | Yes | ||
| 9 | COG3 | 1434654_at 1456286_at | 20495 | -3.146 | -0.5659 | Yes | ||
| 10 | EIF4ENIF1 | 1431075_a_at 1439169_at | 20789 | -3.583 | -0.4757 | Yes | ||
| 11 | RAMP1 | 1417481_at 1447474_at | 20914 | -3.763 | -0.3726 | Yes | ||
| 12 | ABCG1 | 1423570_at 1455221_at | 21326 | -4.729 | -0.2548 | Yes | ||
| 13 | MCL1 | 1416880_at 1416881_at 1437527_x_at 1448503_at 1456243_x_at 1456381_x_at | 21868 | -9.776 | 0.0030 | Yes |

