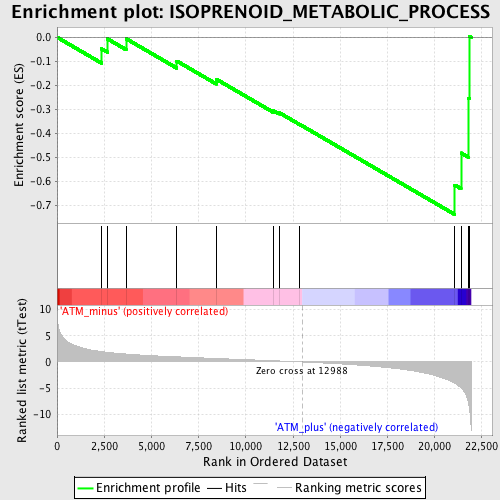
Profile of the Running ES Score & Positions of GeneSet Members on the Rank Ordered List
| Dataset | Set_02_ATM_minus_versus_ATM_plus.phenotype_ATM_minus_versus_ATM_plus.cls #ATM_minus_versus_ATM_plus.phenotype_ATM_minus_versus_ATM_plus.cls #ATM_minus_versus_ATM_plus_repos |
| Phenotype | phenotype_ATM_minus_versus_ATM_plus.cls#ATM_minus_versus_ATM_plus_repos |
| Upregulated in class | ATM_plus |
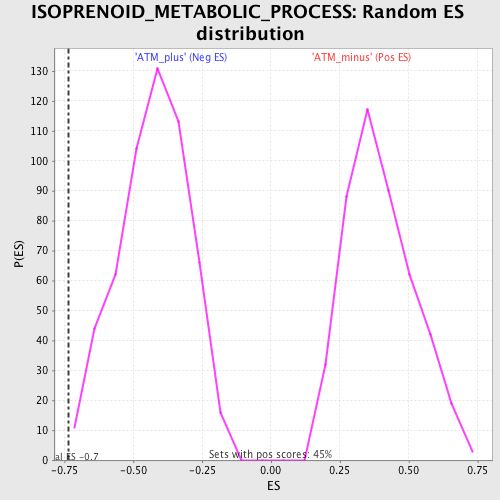
| GeneSet | ISOPRENOID_METABOLIC_PROCESS |
| Enrichment Score (ES) | -0.7365085 |
| Normalized Enrichment Score (NES) | -1.7301158 |
| Nominal p-value | 0.0036563072 |
| FDR q-value | 0.4062706 |
| FWER p-Value | 0.962 |
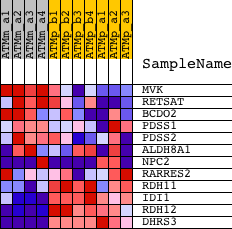
| PROBE | DESCRIPTION (from dataset) | GENE SYMBOL | GENE_TITLE | RANK IN GENE LIST | RANK METRIC SCORE | RUNNING ES | CORE ENRICHMENT | |
|---|---|---|---|---|---|---|---|---|
| 1 | MVK | 1418052_at | 2356 | 1.968 | -0.0479 | No | ||
| 2 | RETSAT | 1424715_at | 2664 | 1.837 | -0.0064 | No | ||
| 3 | BCDO2 | 1421221_at | 3655 | 1.512 | -0.0058 | No | ||
| 4 | PDSS1 | 1431893_a_at 1438506_s_at 1454090_at | 6337 | 0.976 | -0.0986 | No | ||
| 5 | PDSS2 | 1430723_at 1444085_at 1459473_at | 8436 | 0.659 | -0.1744 | No | ||
| 6 | ALDH8A1 | 1427336_at 1427337_at | 11451 | 0.232 | -0.3048 | No | ||
| 7 | NPC2 | 1416901_at 1443266_at 1448513_a_at 1455768_at | 11760 | 0.188 | -0.3132 | No | ||
| 8 | RARRES2 | 1425091_at 1428538_s_at 1437902_s_at | 12848 | 0.026 | -0.3620 | No | ||
| 9 | RDH11 | 1418760_at 1449209_a_at | 21060 | -4.042 | -0.6143 | Yes | ||
| 10 | IDI1 | 1423804_a_at 1451122_at | 21392 | -4.911 | -0.4808 | Yes | ||
| 11 | RDH12 | 1424256_at 1431010_a_at | 21799 | -8.116 | -0.2539 | Yes | ||
| 12 | DHRS3 | 1448390_a_at | 21826 | -8.596 | 0.0049 | Yes |