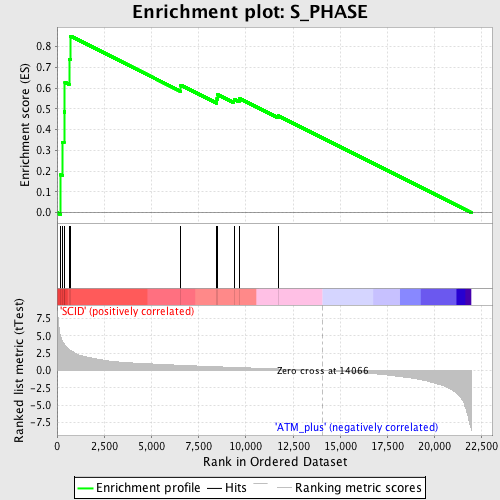
Profile of the Running ES Score & Positions of GeneSet Members on the Rank Ordered List
| Dataset | Set_01_SCID_versus_ATM_plus.phenotype_SCID_versus_ATM_plus.cls #SCID_versus_ATM_plus.phenotype_SCID_versus_ATM_plus.cls #SCID_versus_ATM_plus_repos |
| Phenotype | phenotype_SCID_versus_ATM_plus.cls#SCID_versus_ATM_plus_repos |
| Upregulated in class | SCID |
| GeneSet | S_PHASE |
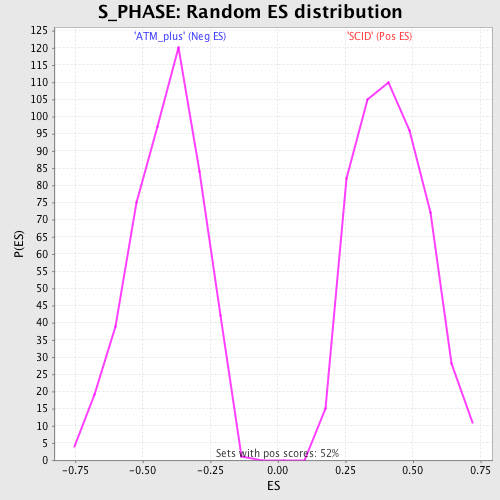
| Enrichment Score (ES) | 0.8503851 |
| Normalized Enrichment Score (NES) | 2.0291326 |
| Nominal p-value | 0.0 |
| FDR q-value | 0.0017288077 |
| FWER p-Value | 0.024 |
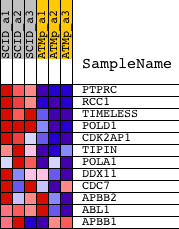
| PROBE | DESCRIPTION (from dataset) | GENE SYMBOL | GENE_TITLE | RANK IN GENE LIST | RANK METRIC SCORE | RUNNING ES | CORE ENRICHMENT | |
|---|---|---|---|---|---|---|---|---|
| 1 | PTPRC | 1422124_a_at 1440165_at | 195 | 4.864 | 0.1816 | Yes | ||
| 2 | RCC1 | 1416962_at | 298 | 4.130 | 0.3388 | Yes | ||
| 3 | TIMELESS | 1417586_at 1417587_at | 369 | 3.824 | 0.4853 | Yes | ||
| 4 | POLD1 | 1448187_at 1456055_x_at | 413 | 3.679 | 0.6275 | Yes | ||
| 5 | CDK2AP1 | 1426885_a_at 1435509_x_at 1456314_x_at | 637 | 3.096 | 0.7386 | Yes | ||
| 6 | TIPIN | 1426612_at | 707 | 2.935 | 0.8504 | Yes | ||
| 7 | POLA1 | 1419397_at 1456285_at 1459319_at 1459963_at | 6551 | 0.762 | 0.6137 | No | ||
| 8 | DDX11 | 1438447_at 1441062_at | 8464 | 0.554 | 0.5482 | No | ||
| 9 | CDC7 | 1426002_a_at 1426021_a_at | 8493 | 0.550 | 0.5685 | No | ||
| 10 | APBB2 | 1426719_at 1426720_at 1440135_at 1446481_at 1452342_at | 9368 | 0.464 | 0.5468 | No | ||
| 11 | ABL1 | 1423999_at 1441291_at 1444134_at 1445153_at | 9640 | 0.436 | 0.5515 | No | ||
| 12 | APBB1 | 1423892_at 1423893_x_at | 11716 | 0.238 | 0.4661 | No |