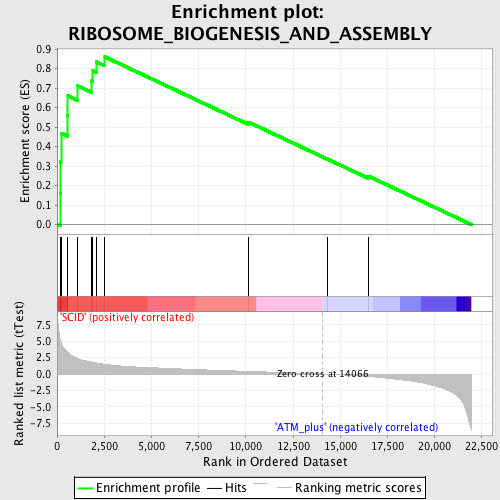
Profile of the Running ES Score & Positions of GeneSet Members on the Rank Ordered List
| Dataset | Set_01_SCID_versus_ATM_plus.phenotype_SCID_versus_ATM_plus.cls #SCID_versus_ATM_plus.phenotype_SCID_versus_ATM_plus.cls #SCID_versus_ATM_plus_repos |
| Phenotype | phenotype_SCID_versus_ATM_plus.cls#SCID_versus_ATM_plus_repos |
| Upregulated in class | SCID |
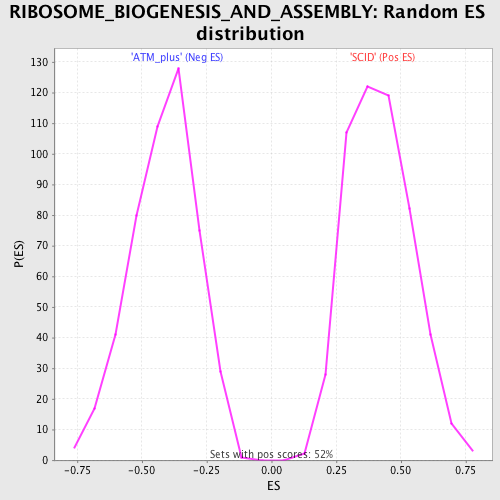
| GeneSet | RIBOSOME_BIOGENESIS_AND_ASSEMBLY |
| Enrichment Score (ES) | 0.8601418 |
| Normalized Enrichment Score (NES) | 2.0540333 |
| Nominal p-value | 0.0 |
| FDR q-value | 0.0013549727 |
| FWER p-Value | 0.016 |
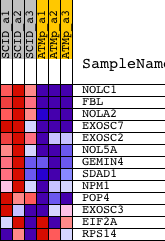
| PROBE | DESCRIPTION (from dataset) | GENE SYMBOL | GENE_TITLE | RANK IN GENE LIST | RANK METRIC SCORE | RUNNING ES | CORE ENRICHMENT | |
|---|---|---|---|---|---|---|---|---|
| 1 | NOLC1 | 1428869_at 1428870_at 1450087_a_at | 157 | 5.258 | 0.1596 | Yes | ||
| 2 | FBL | 1416684_at 1416685_s_at | 166 | 5.109 | 0.3213 | Yes | ||
| 3 | NOLA2 | 1416605_at 1416606_s_at | 206 | 4.730 | 0.4695 | Yes | ||
| 4 | EXOSC7 | 1448365_at | 555 | 3.279 | 0.5577 | Yes | ||
| 5 | EXOSC2 | 1426630_at 1446994_at | 573 | 3.250 | 0.6600 | Yes | ||
| 6 | NOL5A | 1426533_at 1455035_s_at | 1067 | 2.361 | 0.7124 | Yes | ||
| 7 | GEMIN4 | 1433622_at | 1814 | 1.838 | 0.7367 | Yes | ||
| 8 | SDAD1 | 1437088_at 1452454_at | 1898 | 1.783 | 0.7894 | Yes | ||
| 9 | NPM1 | 1415839_a_at 1420267_at 1420268_x_at 1420269_at 1432416_a_at | 2077 | 1.682 | 0.8347 | Yes | ||
| 10 | POP4 | 1448419_at | 2534 | 1.459 | 0.8601 | Yes | ||
| 11 | EXOSC3 | 1431502_a_at | 10153 | 0.388 | 0.5250 | No | ||
| 12 | EIF2A | 1434452_x_at 1460575_at | 14297 | -0.027 | 0.3369 | No | ||
| 13 | RPS14 | 1436586_x_at | 16475 | -0.363 | 0.2491 | No |