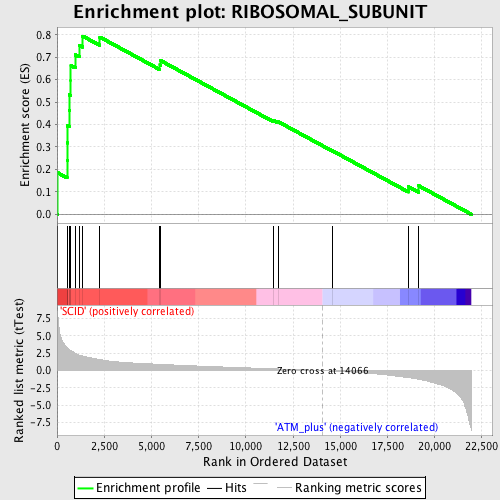
Profile of the Running ES Score & Positions of GeneSet Members on the Rank Ordered List
| Dataset | Set_01_SCID_versus_ATM_plus.phenotype_SCID_versus_ATM_plus.cls #SCID_versus_ATM_plus.phenotype_SCID_versus_ATM_plus.cls #SCID_versus_ATM_plus_repos |
| Phenotype | phenotype_SCID_versus_ATM_plus.cls#SCID_versus_ATM_plus_repos |
| Upregulated in class | SCID |
| GeneSet | RIBOSOMAL_SUBUNIT |
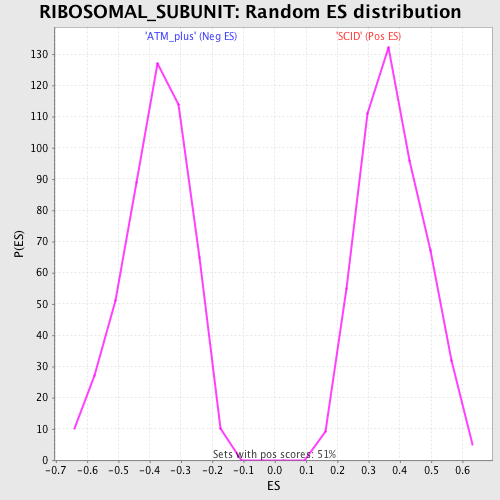
| Enrichment Score (ES) | 0.79379237 |
| Normalized Enrichment Score (NES) | 2.115198 |
| Nominal p-value | 0.0 |
| FDR q-value | 5.6967593E-4 |
| FWER p-Value | 0.0050 |
| PROBE | DESCRIPTION (from dataset) | GENE SYMBOL | GENE_TITLE | RANK IN GENE LIST | RANK METRIC SCORE | RUNNING ES | CORE ENRICHMENT | |
|---|---|---|---|---|---|---|---|---|
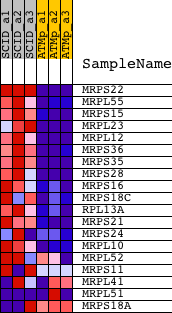
| 1 | MRPS22 | 1416595_at 1443032_at | 18 | 7.986 | 0.1856 | Yes | ||
| 2 | MRPL55 | 1429453_a_at | 528 | 3.351 | 0.2406 | Yes | ||
| 3 | MRPS15 | 1430100_at 1449294_at 1456109_a_at | 538 | 3.329 | 0.3179 | Yes | ||
| 4 | MRPL23 | 1416948_at | 549 | 3.290 | 0.3943 | Yes | ||
| 5 | MRPL12 | 1452048_at | 642 | 3.075 | 0.4619 | Yes | ||
| 6 | MRPS36 | 1423242_at | 656 | 3.044 | 0.5323 | Yes | ||
| 7 | MRPS35 | 1452111_at | 731 | 2.875 | 0.5961 | Yes | ||
| 8 | MRPS28 | 1452585_at | 734 | 2.871 | 0.6630 | Yes | ||
| 9 | MRPS16 | 1448869_a_at | 969 | 2.487 | 0.7104 | Yes | ||
| 10 | MRPS18C | 1427901_at | 1171 | 2.233 | 0.7534 | Yes | ||
| 11 | RPL13A | 1417608_a_at 1433928_a_at 1455001_x_at 1455485_x_at | 1355 | 2.088 | 0.7938 | Yes | ||
| 12 | MRPS21 | 1422451_at | 2265 | 1.587 | 0.7894 | No | ||
| 13 | MRPS24 | 1438563_s_at 1450865_s_at | 5448 | 0.902 | 0.6653 | No | ||
| 14 | MRPL10 | 1418112_at | 5467 | 0.900 | 0.6854 | No | ||
| 15 | MRPL52 | 1415761_at 1415762_x_at 1455366_at 1460701_a_at | 11468 | 0.264 | 0.4178 | No | ||
| 16 | MRPS11 | 1455233_at 1460195_at | 11702 | 0.239 | 0.4128 | No | ||
| 17 | MRPL41 | 1428588_a_at 1428589_at 1428590_at | 14561 | -0.060 | 0.2838 | No | ||
| 18 | MRPL51 | 1416877_a_at 1416878_at 1416879_at | 18605 | -1.008 | 0.1229 | No | ||
| 19 | MRPS18A | 1416984_at 1457813_at | 19155 | -1.245 | 0.1269 | No |