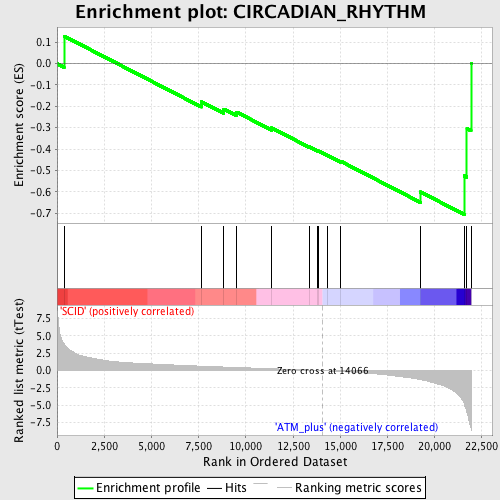
Profile of the Running ES Score & Positions of GeneSet Members on the Rank Ordered List
| Dataset | Set_01_SCID_versus_ATM_plus.phenotype_SCID_versus_ATM_plus.cls #SCID_versus_ATM_plus.phenotype_SCID_versus_ATM_plus.cls #SCID_versus_ATM_plus_repos |
| Phenotype | phenotype_SCID_versus_ATM_plus.cls#SCID_versus_ATM_plus_repos |
| Upregulated in class | ATM_plus |
| GeneSet | CIRCADIAN_RHYTHM |
| Enrichment Score (ES) | -0.70615643 |
| Normalized Enrichment Score (NES) | -1.7395738 |
| Nominal p-value | 0.0057361377 |
| FDR q-value | 0.2253788 |
| FWER p-Value | 0.934 |
| PROBE | DESCRIPTION (from dataset) | GENE SYMBOL | GENE_TITLE | RANK IN GENE LIST | RANK METRIC SCORE | RUNNING ES | CORE ENRICHMENT | |
|---|---|---|---|---|---|---|---|---|
| 1 | TIMELESS | 1417586_at 1417587_at | 369 | 3.824 | 0.1287 | No | ||
| 2 | CARTPT | 1422825_at | 7644 | 0.637 | -0.1788 | No | ||
| 3 | CLOCK | 1418659_at 1435775_at 1439314_at | 8817 | 0.519 | -0.2125 | No | ||
| 4 | AANAT | 1421666_a_at | 9507 | 0.450 | -0.2268 | No | ||
| 5 | PTGDS | 1423859_a_at 1423860_at | 11362 | 0.274 | -0.3010 | No | ||
| 6 | HTR7 | 1422235_at | 13348 | 0.076 | -0.3886 | No | ||
| 7 | HEBP1 | 1418172_at 1457903_at | 13810 | 0.026 | -0.4086 | No | ||
| 8 | PER2 | 1417602_at 1417603_at 1445892_at 1457350_at | 13836 | 0.024 | -0.4089 | No | ||
| 9 | MTNR1A | 1450352_at | 14338 | -0.031 | -0.4305 | No | ||
| 10 | OPN4 | 1421584_at | 15027 | -0.121 | -0.4573 | No | ||
| 11 | PER1 | 1449851_at | 19247 | -1.290 | -0.6007 | Yes | ||
| 12 | ARNTL | 1425099_a_at 1446544_at 1457740_at | 21561 | -4.763 | -0.5248 | Yes | ||
| 13 | CRY1 | 1433733_a_at | 21708 | -5.979 | -0.3038 | Yes | ||
| 14 | EGR3 | 1421486_at 1436329_at | 21923 | -8.252 | 0.0006 | Yes |

