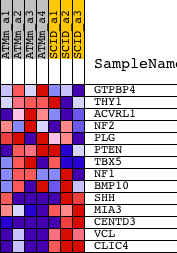
Profile of the Running ES Score & Positions of GeneSet Members on the Rank Ordered List
| Dataset | Set_01_ATM_minus_versus_SCID.phenotype_ATM_minus_versus_SCID.cls #ATM_minus_versus_SCID |
| Phenotype | phenotype_ATM_minus_versus_SCID.cls#ATM_minus_versus_SCID |
| Upregulated in class | SCID |
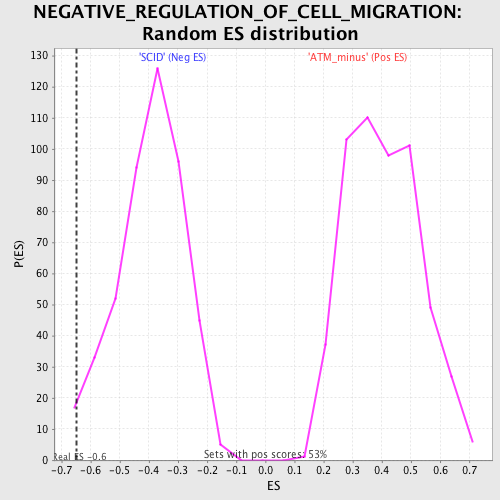
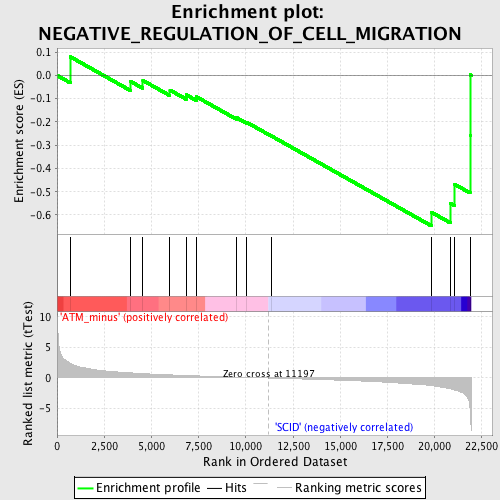
| GeneSet | NEGATIVE_REGULATION_OF_CELL_MIGRATION |
| Enrichment Score (ES) | -0.64721215 |
| Normalized Enrichment Score (NES) | -1.6392891 |
| Nominal p-value | 0.014957265 |
| FDR q-value | 1.0 |
| FWER p-Value | 0.999 |
| PROBE | DESCRIPTION (from dataset) | GENE SYMBOL | GENE_TITLE | RANK IN GENE LIST | RANK METRIC SCORE | RUNNING ES | CORE ENRICHMENT | |
|---|---|---|---|---|---|---|---|---|
| 1 | GTPBP4 | 1423142_a_at 1423143_at 1450873_at | 706 | 2.378 | 0.0799 | No | ||
| 2 | THY1 | 1423135_at | 3892 | 0.840 | -0.0258 | No | ||
| 3 | ACVRL1 | 1435825_at 1451604_a_at | 4544 | 0.718 | -0.0216 | No | ||
| 4 | NF2 | 1421820_a_at 1427708_a_at 1450382_at 1451829_a_at | 5977 | 0.504 | -0.0631 | No | ||
| 5 | PLG | 1416729_at | 6835 | 0.405 | -0.0831 | No | ||
| 6 | PTEN | 1422553_at 1441593_at 1444325_at 1450655_at 1454722_at 1455728_at 1457493_at | 7387 | 0.345 | -0.0920 | No | ||
| 7 | TBX5 | 1425694_at 1425695_at | 9486 | 0.146 | -0.1808 | No | ||
| 8 | NF1 | 1438067_at 1441523_at 1443097_at 1452525_a_at | 10027 | 0.099 | -0.2008 | No | ||
| 9 | BMP10 | 1421763_at | 11378 | -0.017 | -0.2616 | No | ||
| 10 | SHH | 1427571_at 1436869_at | 19833 | -1.245 | -0.5885 | Yes | ||
| 11 | MIA3 | 1459984_at | 20826 | -1.775 | -0.5501 | Yes | ||
| 12 | CENTD3 | 1419833_s_at 1447407_at 1451282_at | 21064 | -1.961 | -0.4684 | Yes | ||
| 13 | VCL | 1416156_at 1416157_at 1445256_at | 21875 | -5.223 | -0.2591 | Yes | ||
| 14 | CLIC4 | 1423392_at 1423393_at 1438606_a_at | 21884 | -5.554 | 0.0024 | Yes |