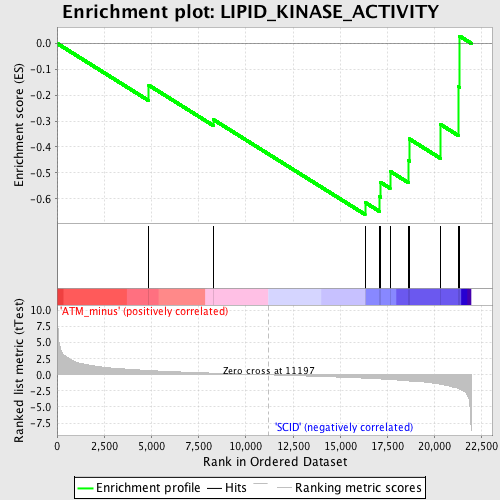
Profile of the Running ES Score & Positions of GeneSet Members on the Rank Ordered List
| Dataset | Set_01_ATM_minus_versus_SCID.phenotype_ATM_minus_versus_SCID.cls #ATM_minus_versus_SCID |
| Phenotype | phenotype_ATM_minus_versus_SCID.cls#ATM_minus_versus_SCID |
| Upregulated in class | SCID |
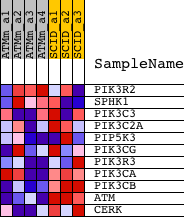
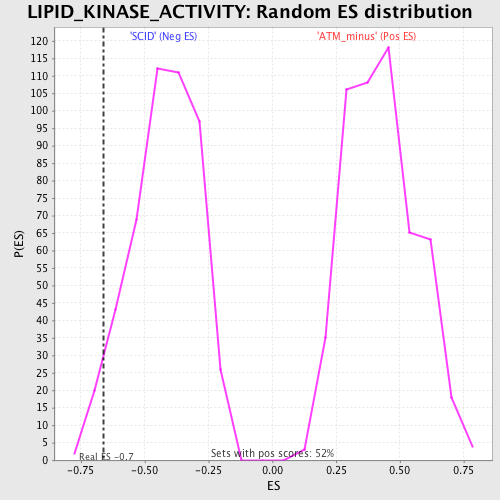
| GeneSet | LIPID_KINASE_ACTIVITY |
| Enrichment Score (ES) | -0.66063 |
| Normalized Enrichment Score (NES) | -1.5698969 |
| Nominal p-value | 0.041666668 |
| FDR q-value | 1.0 |
| FWER p-Value | 1.0 |
| PROBE | DESCRIPTION (from dataset) | GENE SYMBOL | GENE_TITLE | RANK IN GENE LIST | RANK METRIC SCORE | RUNNING ES | CORE ENRICHMENT | |
|---|---|---|---|---|---|---|---|---|
| 1 | PIK3R2 | 1418463_at | 4858 | 0.665 | -0.1617 | No | ||
| 2 | SPHK1 | 1451596_a_at | 8271 | 0.259 | -0.2940 | No | ||
| 3 | PIK3C3 | 1425580_a_at | 16310 | -0.520 | -0.6139 | Yes | ||
| 4 | PIK3C2A | 1421023_at 1425862_a_at 1443655_s_at | 17090 | -0.634 | -0.5924 | Yes | ||
| 5 | PIP5K3 | 1422994_at 1446974_at 1452994_at | 17130 | -0.643 | -0.5363 | Yes | ||
| 6 | PIK3CG | 1422707_at 1422708_at | 17635 | -0.728 | -0.4938 | Yes | ||
| 7 | PIK3R3 | 1445097_at 1447068_at 1456482_at | 18625 | -0.950 | -0.4534 | Yes | ||
| 8 | PIK3CA | 1423144_at 1429434_at 1429435_x_at 1440054_at 1453134_at 1460326_at | 18657 | -0.956 | -0.3688 | Yes | ||
| 9 | PIK3CB | 1445731_at 1453069_at | 20292 | -1.458 | -0.3122 | Yes | ||
| 10 | ATM | 1421205_at 1428830_at | 21244 | -2.101 | -0.1666 | Yes | ||
| 11 | CERK | 1434034_at | 21322 | -2.202 | 0.0280 | Yes |