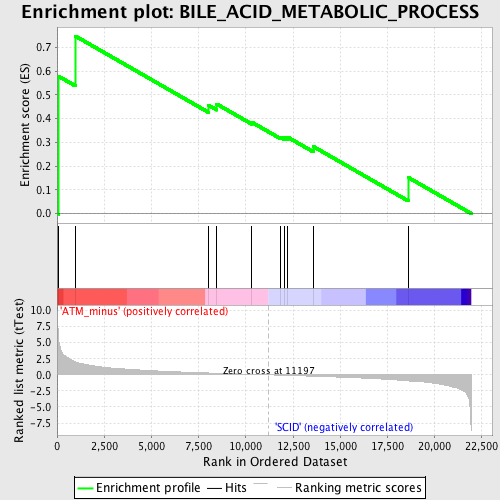
Profile of the Running ES Score & Positions of GeneSet Members on the Rank Ordered List
| Dataset | Set_01_ATM_minus_versus_SCID.phenotype_ATM_minus_versus_SCID.cls #ATM_minus_versus_SCID |
| Phenotype | phenotype_ATM_minus_versus_SCID.cls#ATM_minus_versus_SCID |
| Upregulated in class | ATM_minus |
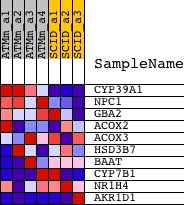
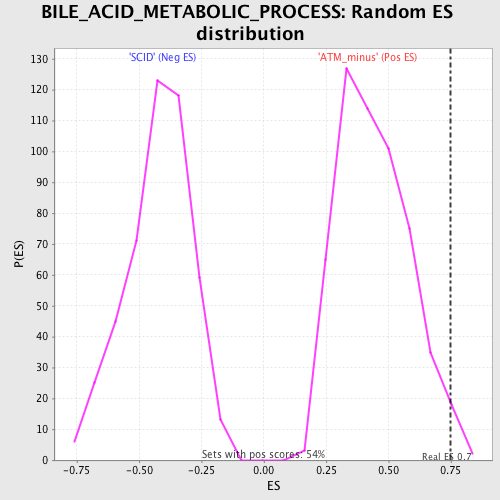
| GeneSet | BILE_ACID_METABOLIC_PROCESS |
| Enrichment Score (ES) | 0.74748343 |
| Normalized Enrichment Score (NES) | 1.6907177 |
| Nominal p-value | 0.02037037 |
| FDR q-value | 0.42273656 |
| FWER p-Value | 0.989 |
| PROBE | DESCRIPTION (from dataset) | GENE SYMBOL | GENE_TITLE | RANK IN GENE LIST | RANK METRIC SCORE | RUNNING ES | CORE ENRICHMENT | |
|---|---|---|---|---|---|---|---|---|
| 1 | CYP39A1 | 1418780_at | 83 | 5.546 | 0.5781 | Yes | ||
| 2 | NPC1 | 1423086_at | 973 | 2.000 | 0.7475 | Yes | ||
| 3 | GBA2 | 1419980_at 1434271_at | 8015 | 0.285 | 0.4563 | No | ||
| 4 | ACOX2 | 1420673_a_at | 8457 | 0.239 | 0.4613 | No | ||
| 5 | ACOX3 | 1420684_at 1437352_at | 10307 | 0.077 | 0.3850 | No | ||
| 6 | HSD3B7 | 1416968_a_at 1442912_at | 11827 | -0.058 | 0.3218 | No | ||
| 7 | BAAT | 1419001_at 1419002_s_at | 12045 | -0.076 | 0.3199 | No | ||
| 8 | CYP7B1 | 1421074_at 1421075_s_at 1446995_at | 12216 | -0.091 | 0.3217 | No | ||
| 9 | NR1H4 | 1419105_at | 13573 | -0.214 | 0.2823 | No | ||
| 10 | AKR1D1 | 1425771_at 1455100_at | 18597 | -0.944 | 0.1523 | No |