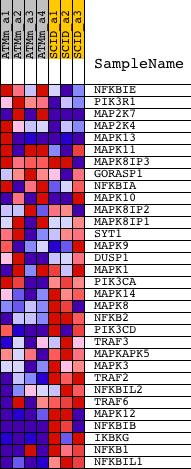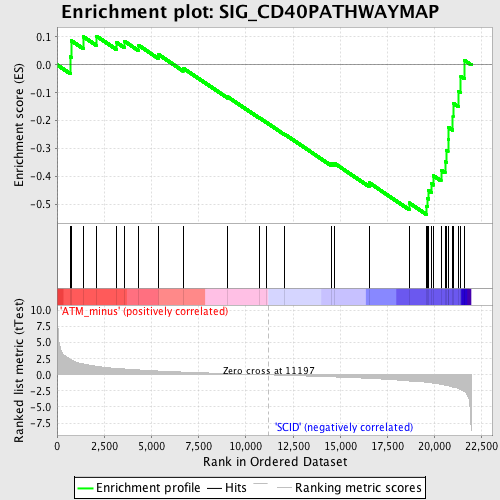
Profile of the Running ES Score & Positions of GeneSet Members on the Rank Ordered List
| Dataset | Set_01_ATM_minus_versus_SCID.phenotype_ATM_minus_versus_SCID.cls #ATM_minus_versus_SCID |
| Phenotype | phenotype_ATM_minus_versus_SCID.cls#ATM_minus_versus_SCID |
| Upregulated in class | SCID |
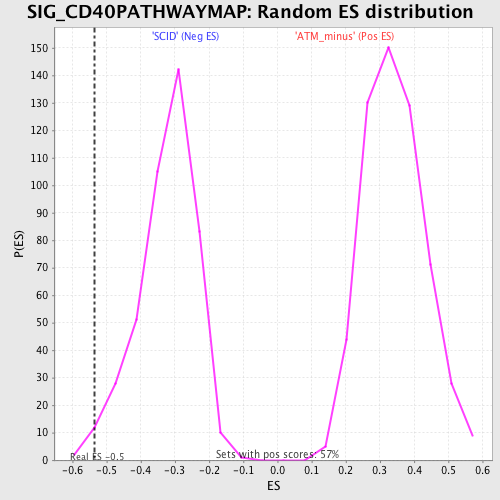
| GeneSet | SIG_CD40PATHWAYMAP |
| Enrichment Score (ES) | -0.5361423 |
| Normalized Enrichment Score (NES) | -1.6617249 |
| Nominal p-value | 0.016129032 |
| FDR q-value | 0.34979504 |
| FWER p-Value | 0.998 |
| PROBE | DESCRIPTION (from dataset) | GENE SYMBOL | GENE_TITLE | RANK IN GENE LIST | RANK METRIC SCORE | RUNNING ES | CORE ENRICHMENT | |
|---|---|---|---|---|---|---|---|---|
| 1 | NFKBIE | 1431843_a_at 1458299_s_at | 702 | 2.384 | 0.0294 | No | ||
| 2 | PIK3R1 | 1425514_at 1425515_at 1438682_at 1444591_at 1451737_at | 749 | 2.311 | 0.0868 | No | ||
| 3 | MAP2K7 | 1421416_at 1425393_a_at 1425512_at 1425513_at 1440442_at 1451736_a_at 1457182_at | 1386 | 1.693 | 0.1014 | No | ||
| 4 | MAP2K4 | 1426233_at 1442679_at 1451982_at | 2090 | 1.312 | 0.1032 | No | ||
| 5 | MAPK13 | 1448871_at | 3156 | 0.995 | 0.0802 | No | ||
| 6 | MAPK11 | 1421925_at 1421926_at | 3578 | 0.905 | 0.0843 | No | ||
| 7 | MAPK8IP3 | 1416437_a_at 1425975_a_at 1436676_at 1460628_at | 4327 | 0.761 | 0.0697 | No | ||
| 8 | GORASP1 | 1425334_at 1451671_at | 5368 | 0.584 | 0.0373 | No | ||
| 9 | NFKBIA | 1420088_at 1420089_at 1438157_s_at 1448306_at 1449731_s_at | 6670 | 0.421 | -0.0112 | No | ||
| 10 | MAPK10 | 1437195_x_at 1448342_at 1458002_at 1458062_at 1458513_at | 9031 | 0.187 | -0.1141 | No | ||
| 11 | MAPK8IP2 | 1418785_at 1418786_at 1435045_s_at 1449225_a_at 1455194_at | 10714 | 0.043 | -0.1898 | No | ||
| 12 | MAPK8IP1 | 1425679_a_at 1440619_at | 11065 | 0.011 | -0.2055 | No | ||
| 13 | SYT1 | 1421990_at 1431191_a_at 1433884_at 1438282_at 1442557_at 1457497_at | 12057 | -0.077 | -0.2488 | No | ||
| 14 | MAPK9 | 1421876_at 1421877_at 1421878_at | 14506 | -0.307 | -0.3526 | No | ||
| 15 | DUSP1 | 1448830_at | 14677 | -0.327 | -0.3520 | No | ||
| 16 | MAPK1 | 1419568_at 1426585_s_at 1442876_at 1453104_at | 16534 | -0.551 | -0.4225 | No | ||
| 17 | PIK3CA | 1423144_at 1429434_at 1429435_x_at 1440054_at 1453134_at 1460326_at | 18657 | -0.956 | -0.4947 | No | ||
| 18 | MAPK14 | 1416703_at 1416704_at 1426104_at 1442364_at 1451927_a_at 1459617_at | 19565 | -1.153 | -0.5064 | Yes | ||
| 19 | MAPK8 | 1420931_at 1420932_at 1437045_at 1440856_at 1457936_at | 19611 | -1.168 | -0.4784 | Yes | ||
| 20 | NFKB2 | 1425902_a_at 1429128_x_at | 19669 | -1.186 | -0.4504 | Yes | ||
| 21 | PIK3CD | 1422991_at 1422992_s_at 1443798_at 1453281_at 1458321_at | 19832 | -1.245 | -0.4257 | Yes | ||
| 22 | TRAF3 | 1418587_at 1444758_at 1449149_at | 19940 | -1.284 | -0.3975 | Yes | ||
| 23 | MAPKAPK5 | 1417016_at 1439828_at | 20336 | -1.480 | -0.3774 | Yes | ||
| 24 | MAPK3 | 1427060_at | 20549 | -1.598 | -0.3459 | Yes | ||
| 25 | TRAF2 | 1451233_at | 20609 | -1.634 | -0.3065 | Yes | ||
| 26 | NFKBIL2 | 1428661_at | 20705 | -1.699 | -0.2671 | Yes | ||
| 27 | TRAF6 | 1421376_at 1421377_at 1435350_at 1443288_at 1446940_at 1446977_at | 20741 | -1.716 | -0.2245 | Yes | ||
| 28 | MAPK12 | 1447823_x_at 1449283_a_at | 20967 | -1.895 | -0.1859 | Yes | ||
| 29 | NFKBIB | 1421266_s_at 1446718_at | 20973 | -1.901 | -0.1372 | Yes | ||
| 30 | IKBKG | 1421208_at 1421209_s_at 1435646_at 1435647_at 1450161_at 1454690_at | 21274 | -2.150 | -0.0955 | Yes | ||
| 31 | NFKB1 | 1427705_a_at 1442949_at | 21385 | -2.296 | -0.0413 | Yes | ||
| 32 | NFKBIL1 | 1449951_at | 21575 | -2.577 | 0.0165 | Yes |